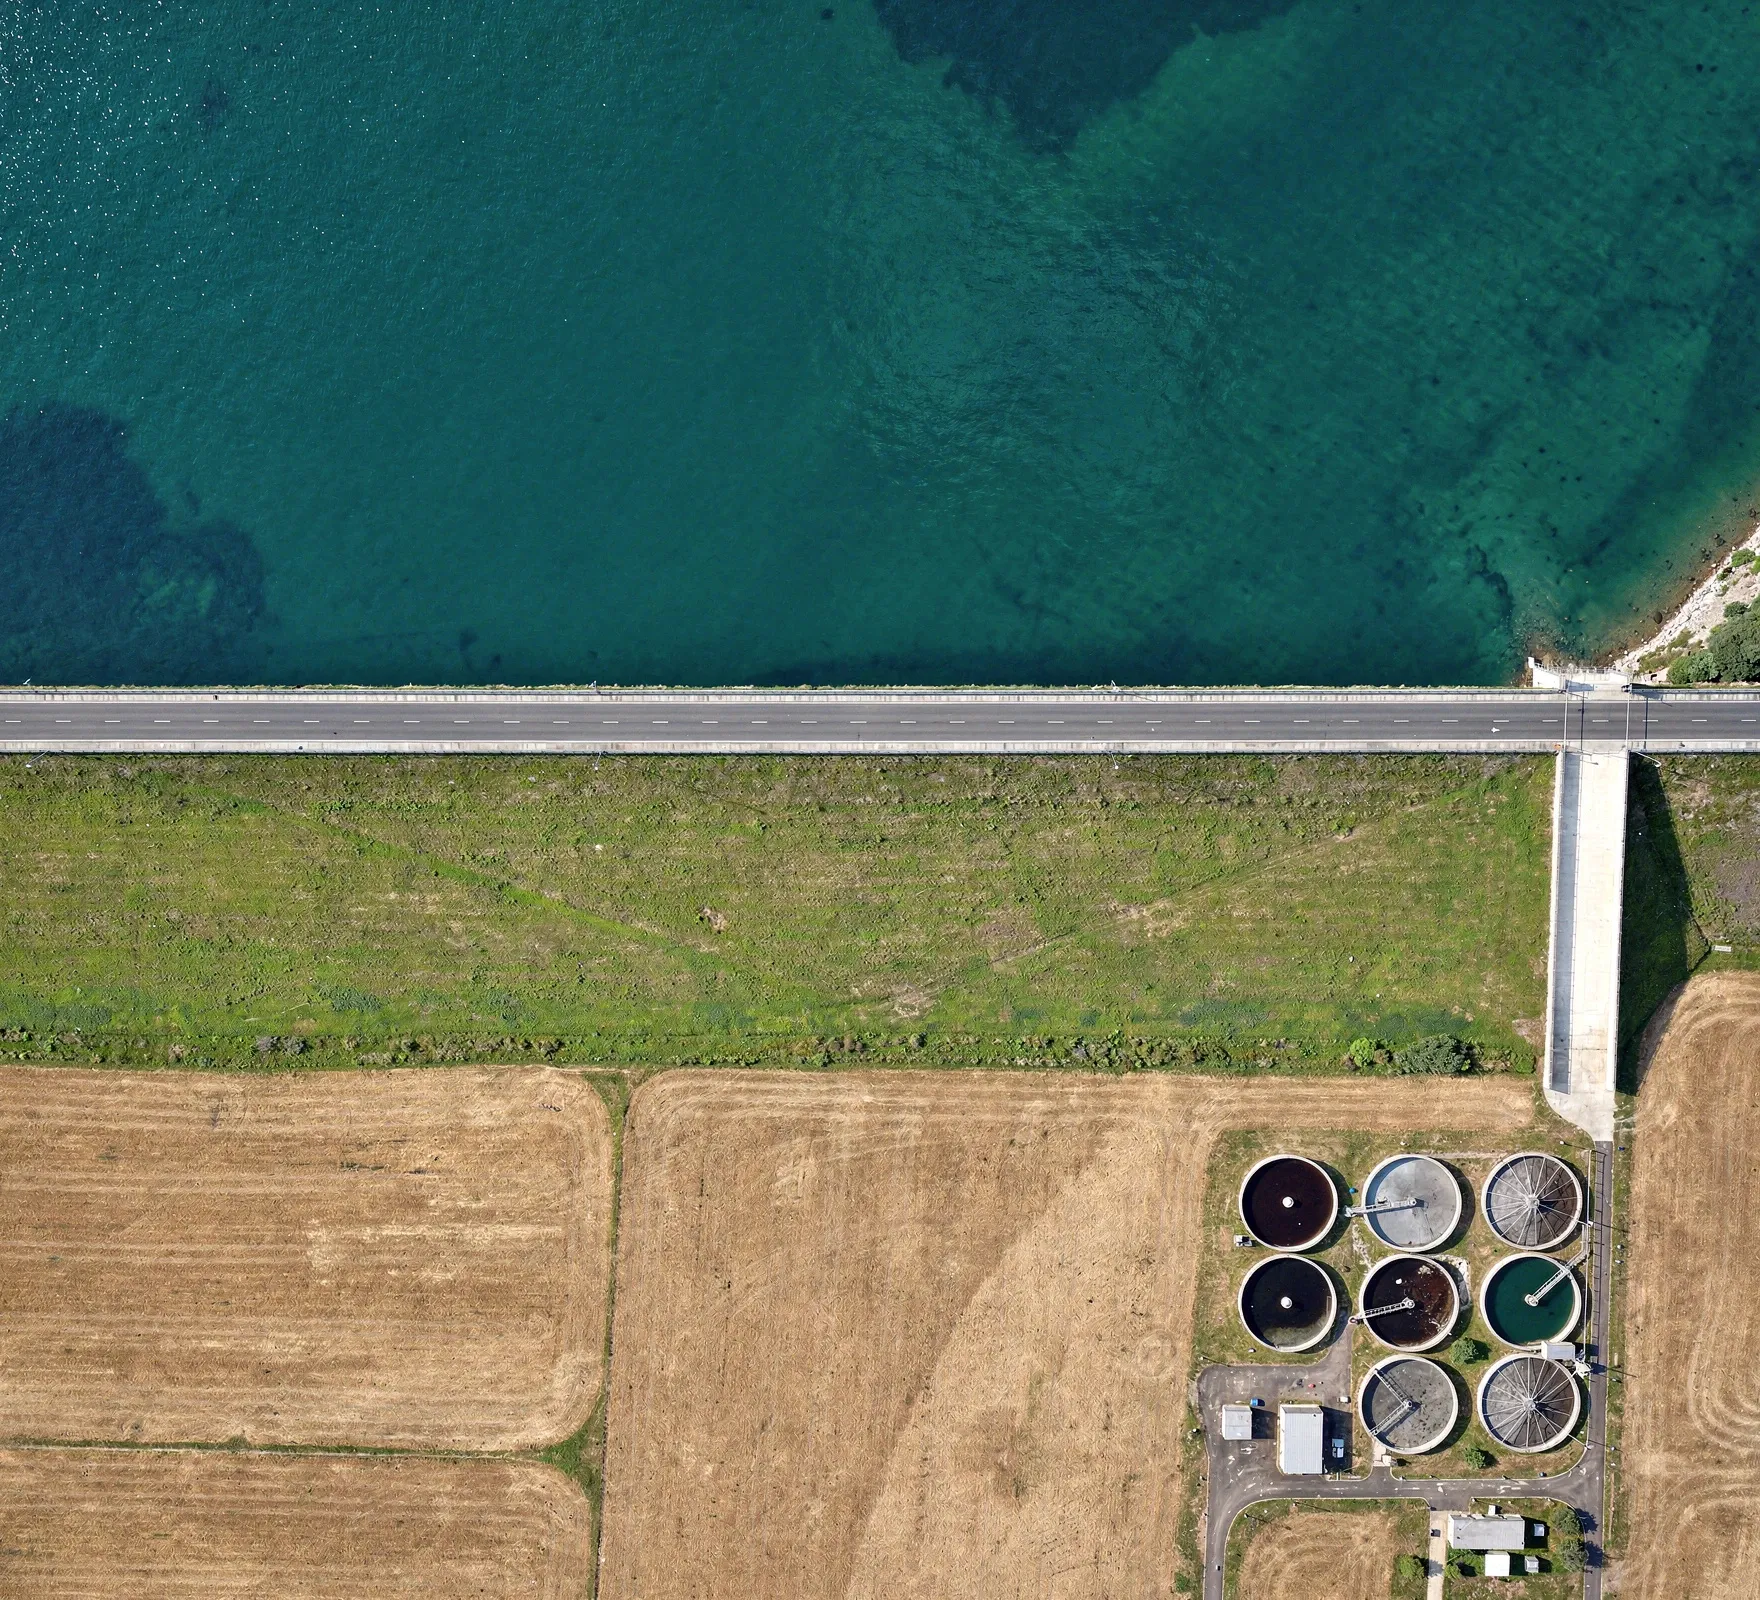
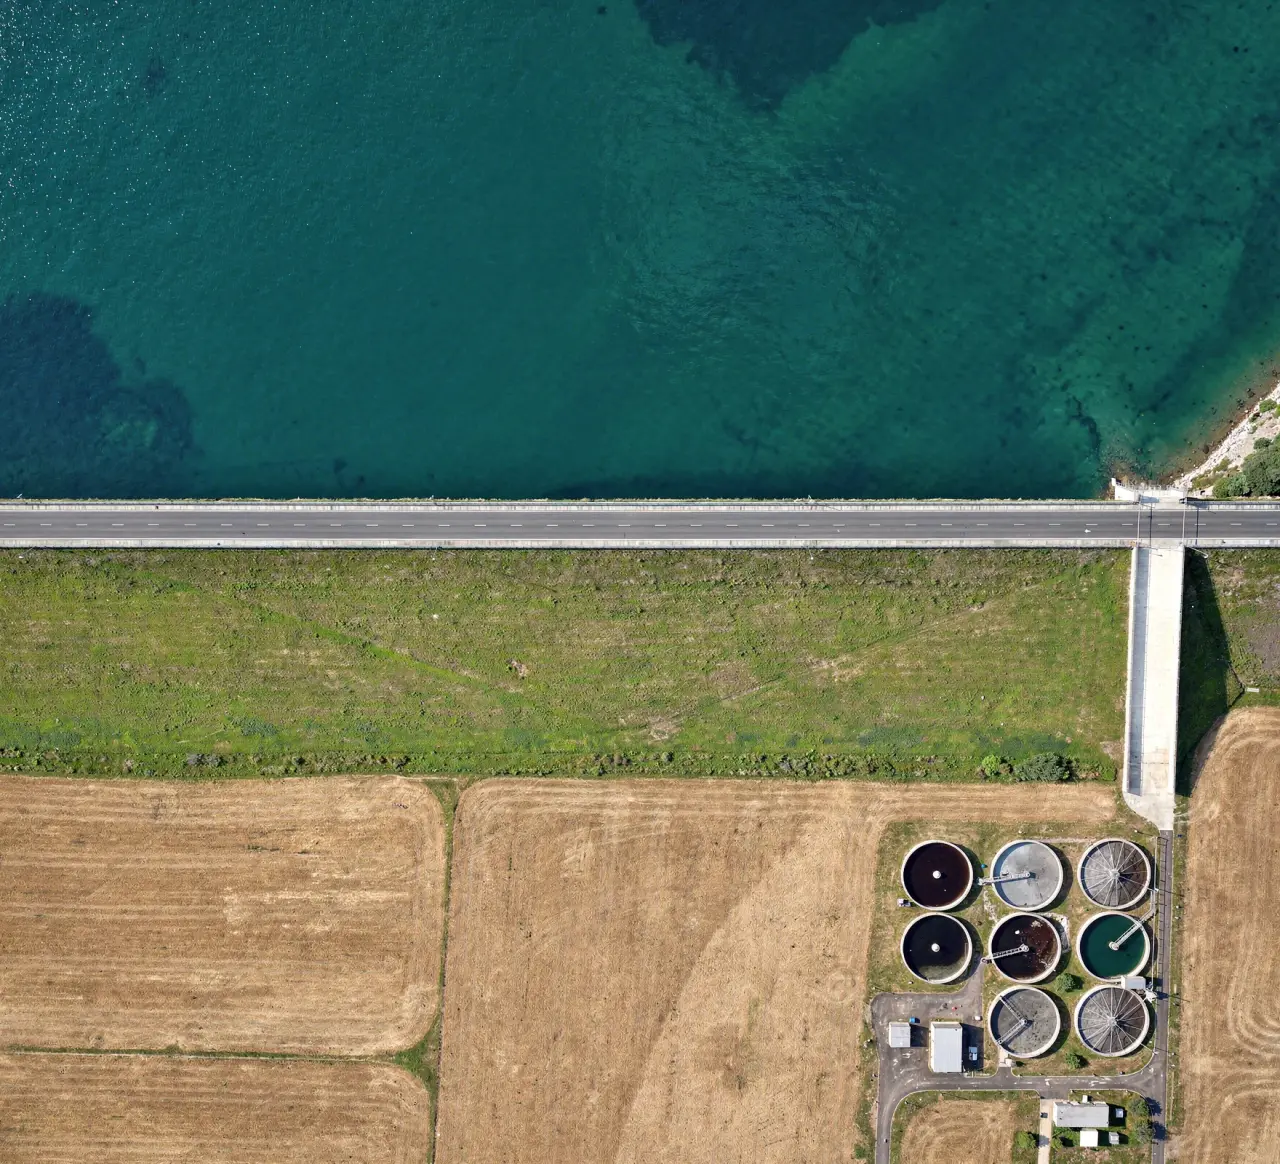
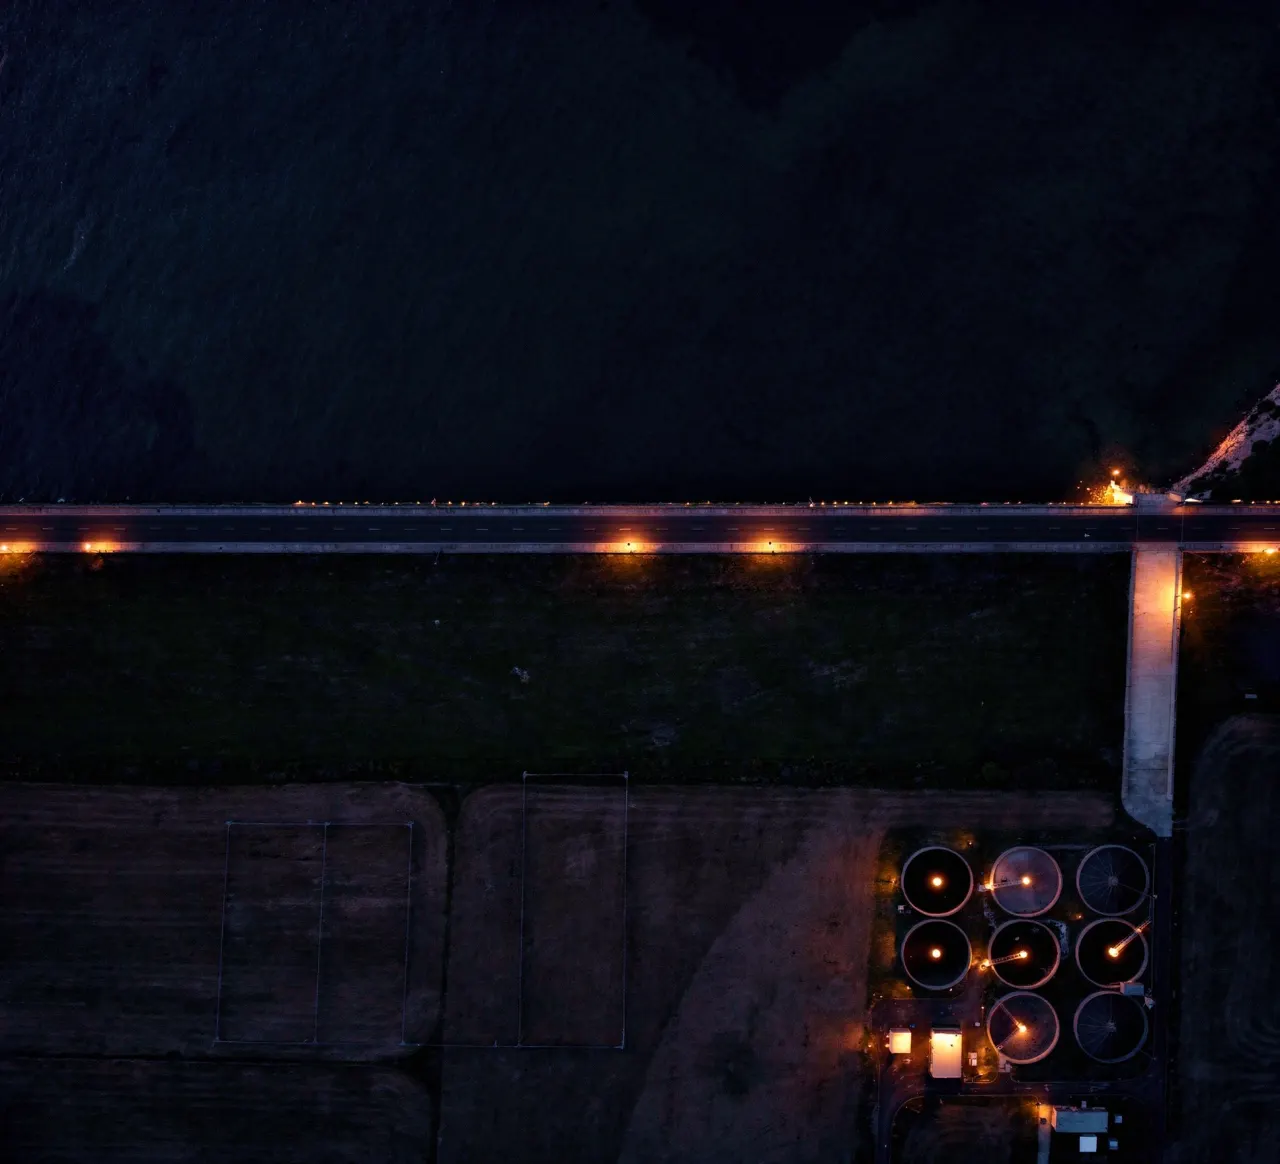
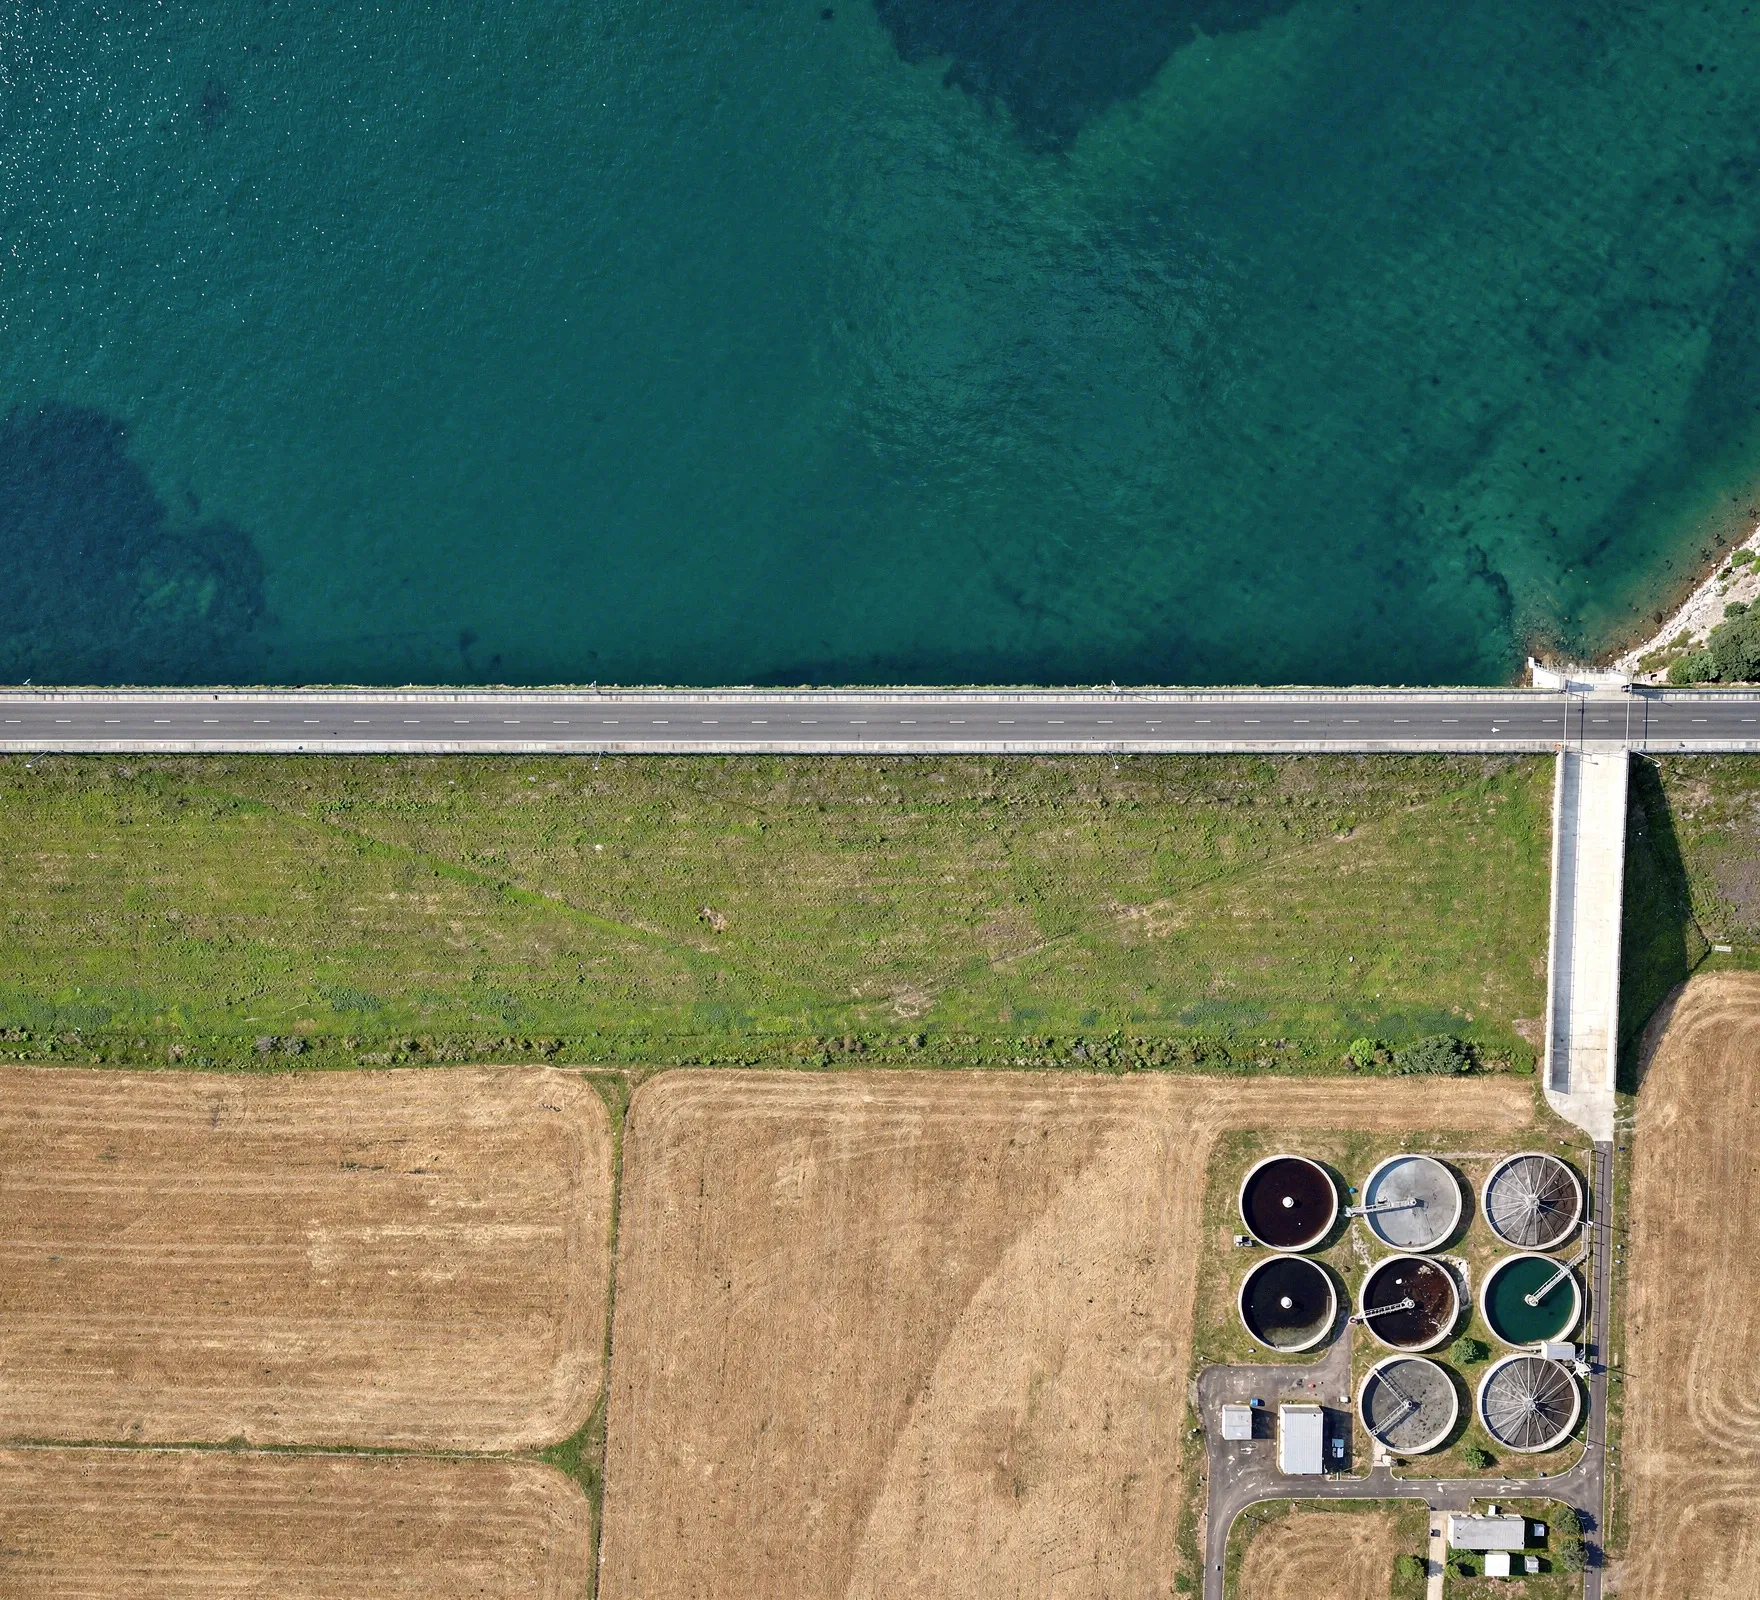

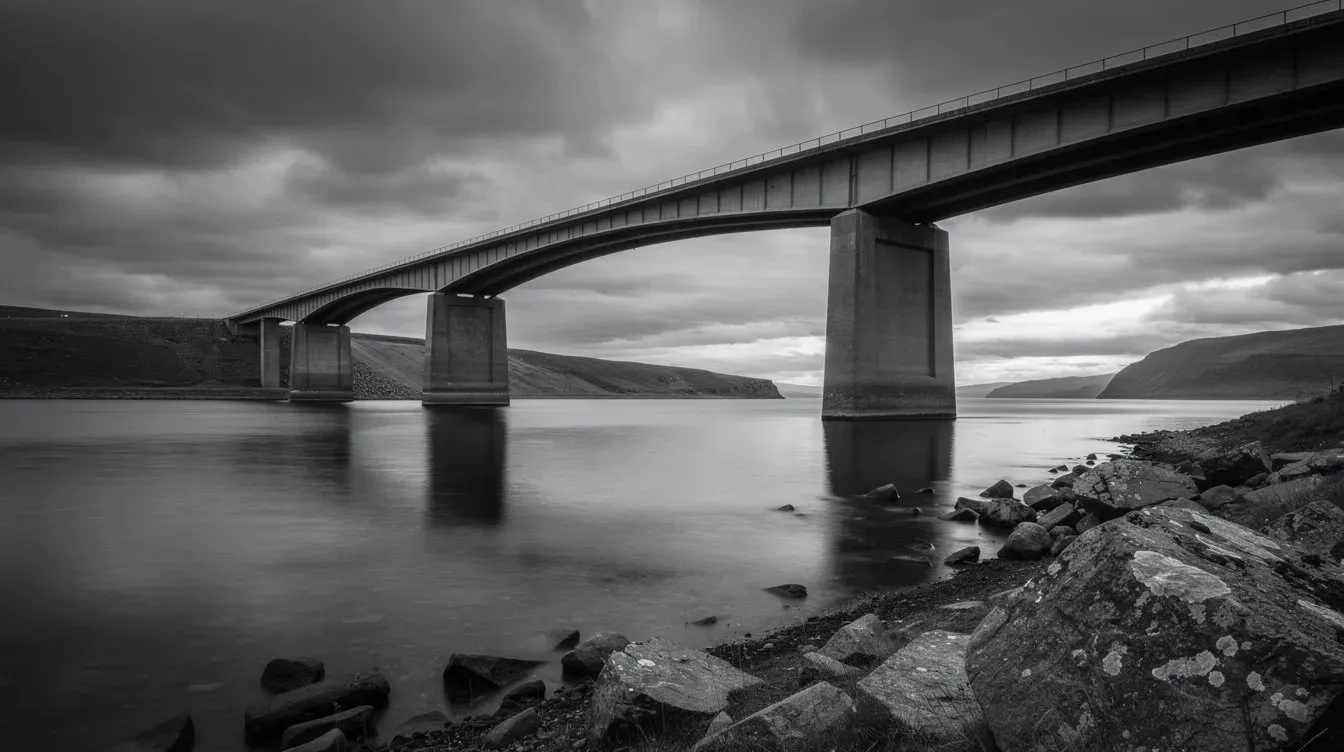
An overhead view of a reservoir, its embankment dam and a nearby water treatment works
Industries

Seven industries, one theme

What changes are coming, what will the impact be and what should we do about them? We provide the answers to the most pressing issues, whatever the situation.

01 / Road

Road

When to intervene on bridges, remotely monitor changes in surface and schedule intervention before an emergency closure but without redundant works.

A multi-level motorway interchange seen from directly above
Closure risk · next 12 months
6% Range 3–9%
Priority 148 of 1,240 structures

Recommendation No intervention this year: the movement is consistent with normal behaviour. Keep in the 2028 programme.

Deck movement · 5-yr trend −1.8 mm/yr Within seasonal range
Tracking · road
  • Movement
  • Heat
  • Change
  • Surface quality
  • Vegetation

The decision

Every structure on a road network has a window for intervention. Too late and you face an emergency closure, too early and the budget goes on assets that had years left. We combine in-situ and satellite data with historical records to understand how each structure has behaved, separating anomalies and areas of concern from normal behaviour. We can look at all aspects of movement, surface change and encroachment.

  • 01

    Separate anomalies and areas of concern from normal behaviour

  • 02

    Avoid unnecessary, disruptive closures

  • 03

    Correlate behaviour with temperature and load

  • 04

    A continuing evidence base for structural reviews

Evidence

02 / Rail

Rail

Rank structures and earthworks along the whole route by how they are actually moving, so next year's programme starts where it is needed.

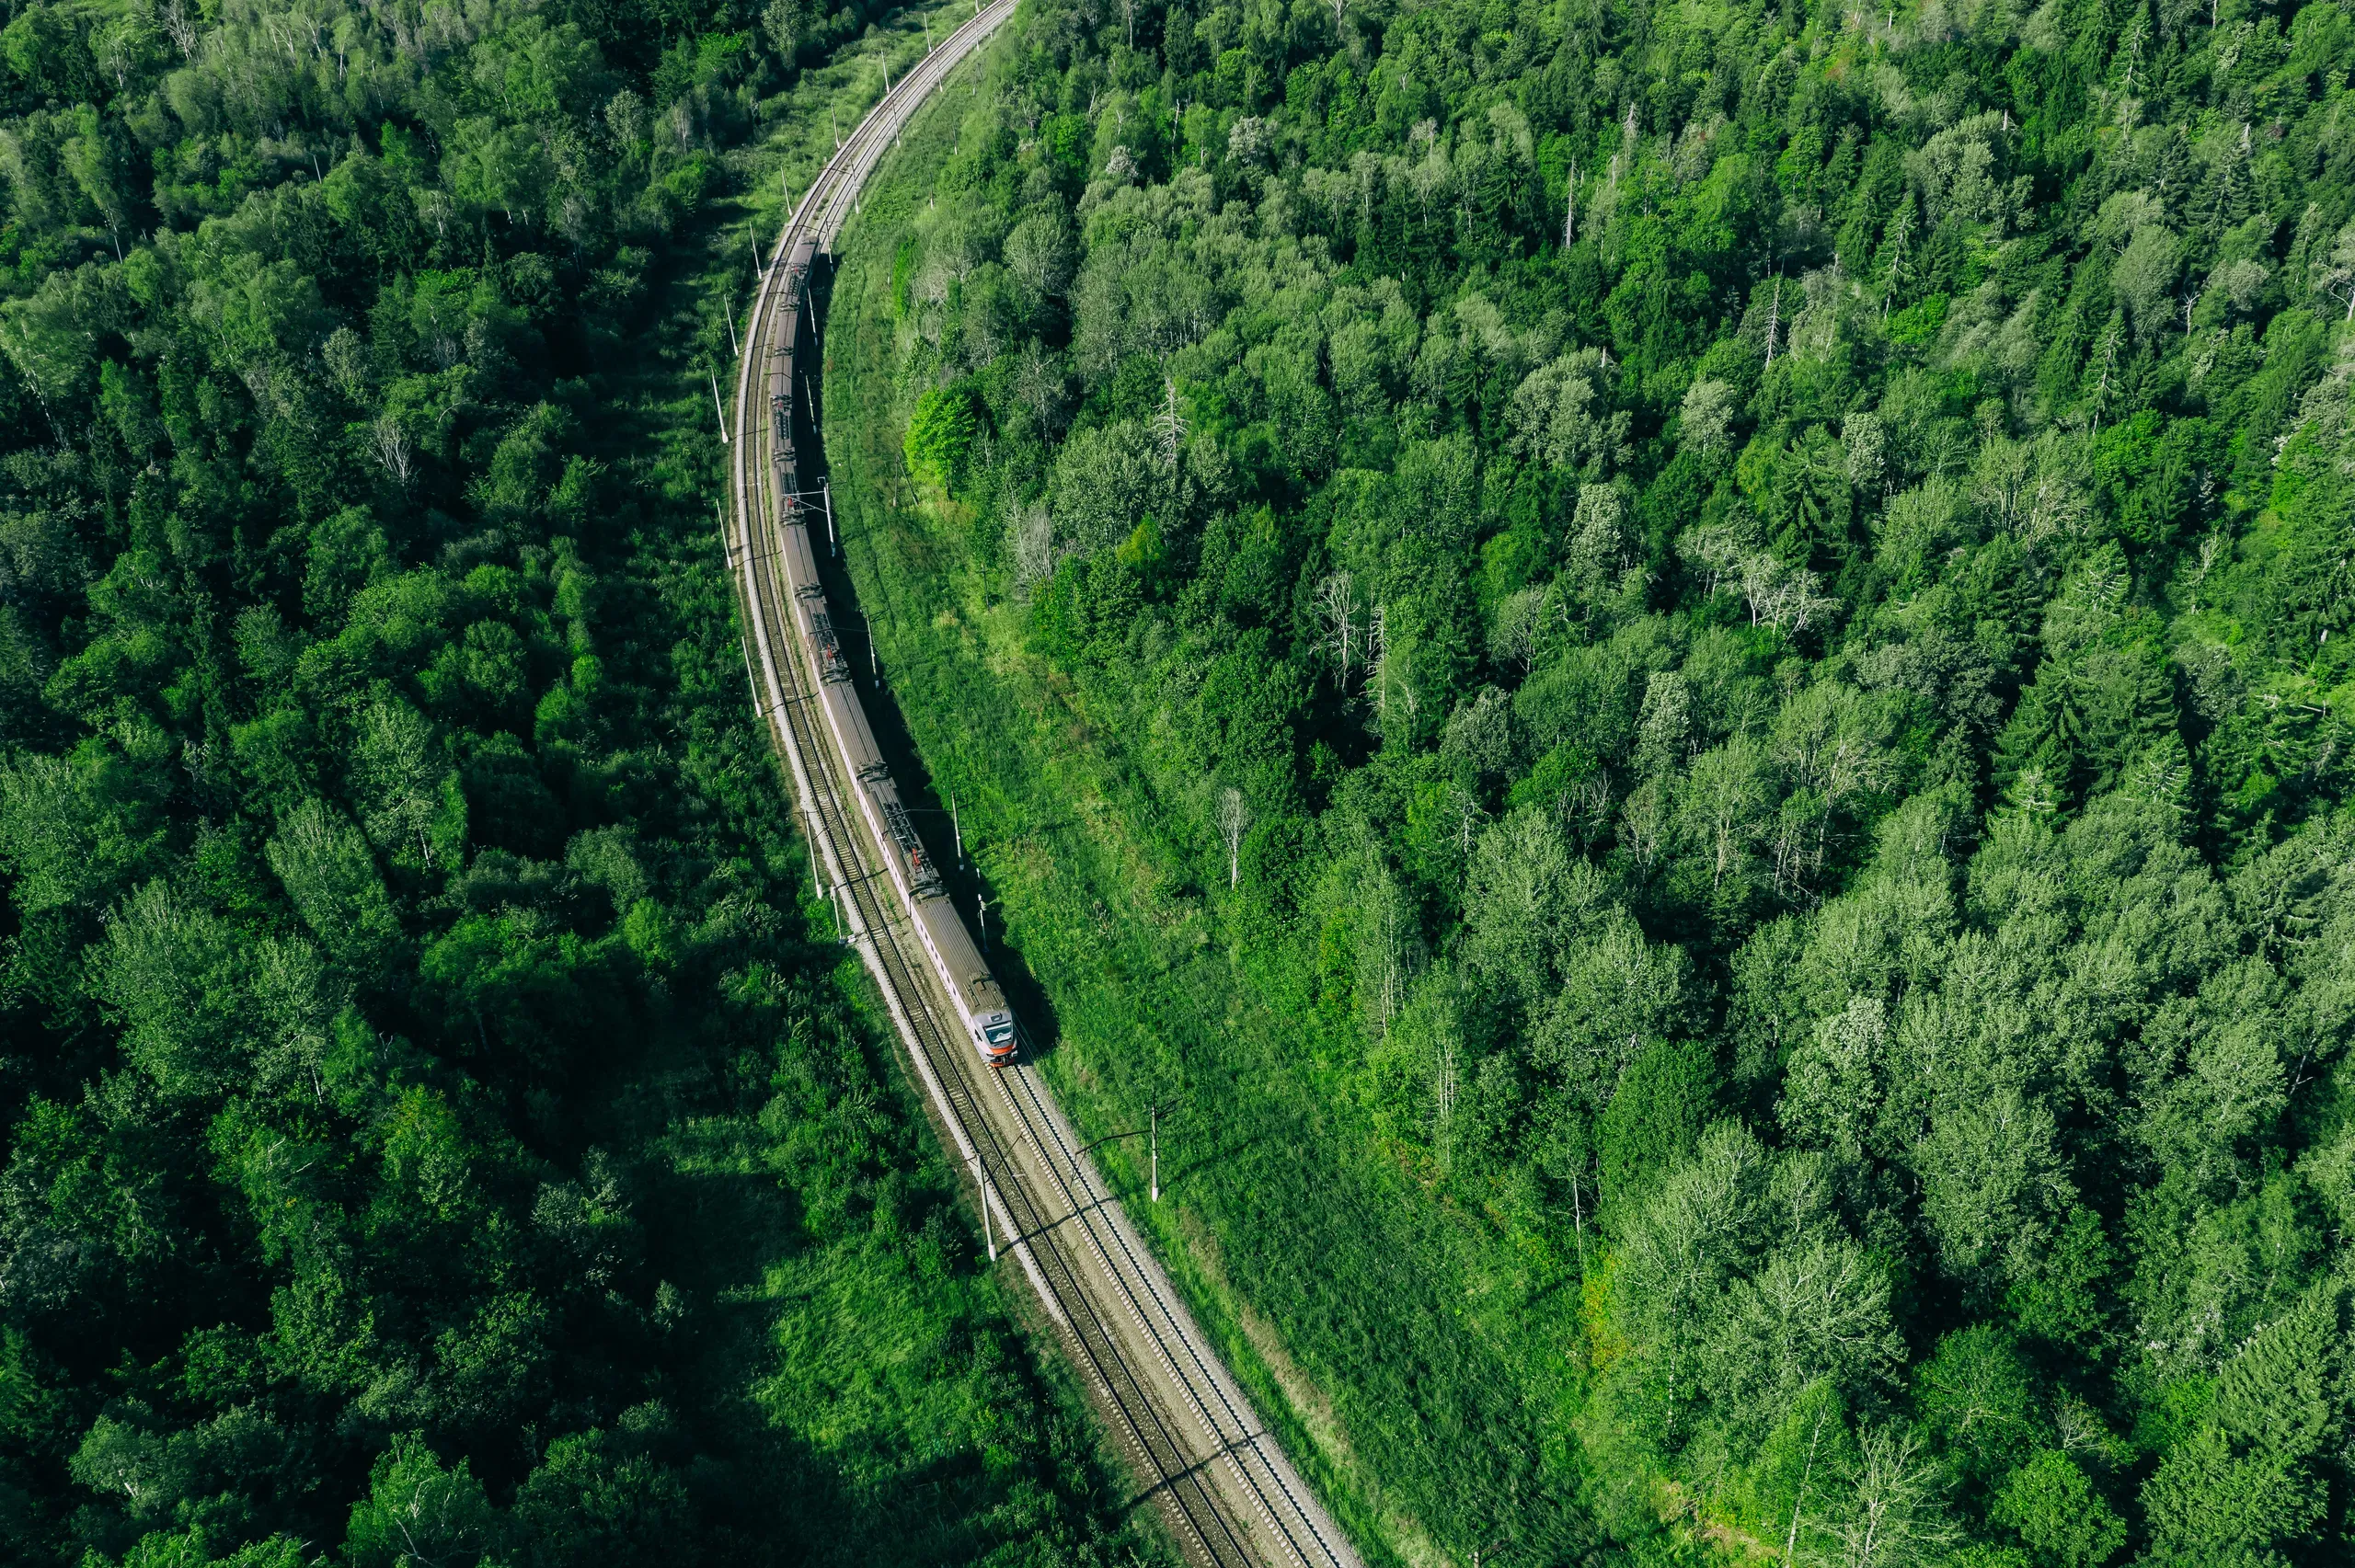
A railway line curving through dense forest, seen from above
Failure risk · next 2 years
31% Range 24–39%
Top 1% of the route

Recommendation Add to next year's strengthening programme. Inspect the abutments within 3 months.

Overbridge settlement · 5-yr −3.1 mm/yr Priority 3 of 1,240
Tracking · rail
  • Movement
  • Heat
  • Change
  • Vegetation

The decision

Rail assets are long, sometimes old and mostly unobserved between inspections. We measure settlement and creep along the route using in-situ and satellite data, show where movement is accelerating, and correlate it with rainfall and temperature. The strengthening programme is then ranked on evidence, not on the last walkover alone.

  • 01

    Route-wide measurement between inspections

  • 02

    Assets ranked by measured movement

  • 03

    Accelerating movement flagged early

  • 04

    Separate anomalies and areas of concern from normal behaviour

03 / Water

Water

Find the lengths of main and the sites where the ground is moving, so replacement and inspection start where failure is most likely. Monitor the surface above mains, sewers and drains to predict change and failure.

Reservoir with an embankment dam and a crest road
Burst risk · next 12 months
22% Range 15–30%
Top 2% of 860 lengths

Recommendation Move this length into next year's replacement programme.

Ground movement · main route −2.6 mm/yr Replace: rank 12 of 860
Tracking · water
  • Movement
  • Change
  • Surface quality

The decision

Buried mains fail where the ground around them moves: shrink–swell clay, subsidence, nearby works. We measure ground movement along the network, add surface signs such as standing water, and combine them with sensor and weather data, so replacement goes where risk is highest. On critical sites we forecast conditions weeks or months ahead.

  • 01

    Fuse sensor, weather and survey data

  • 02

    Forecast flooding and movement risk

  • 03

    Fewer false alarms, fewer lost days

  • 04

    Remote monitoring across the network

Evidence

04 / Electricity

Electricity

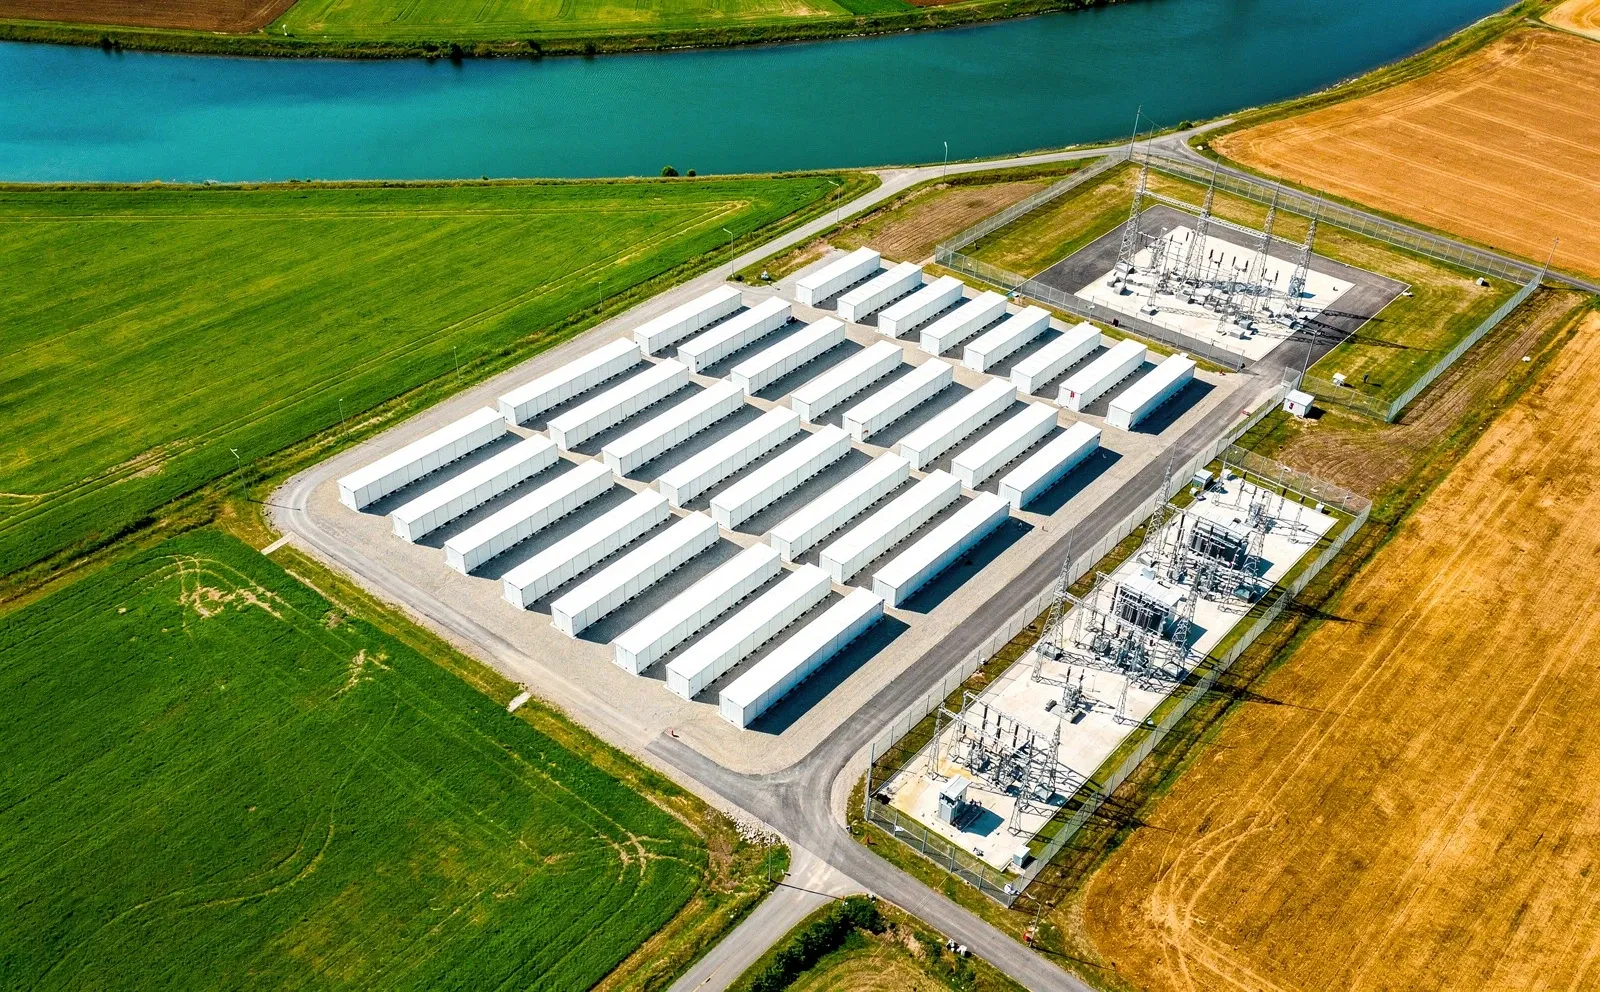
From transmission towers to battery compounds: measure the ground under the network and the growth around it, and plan the work before it becomes an outage.

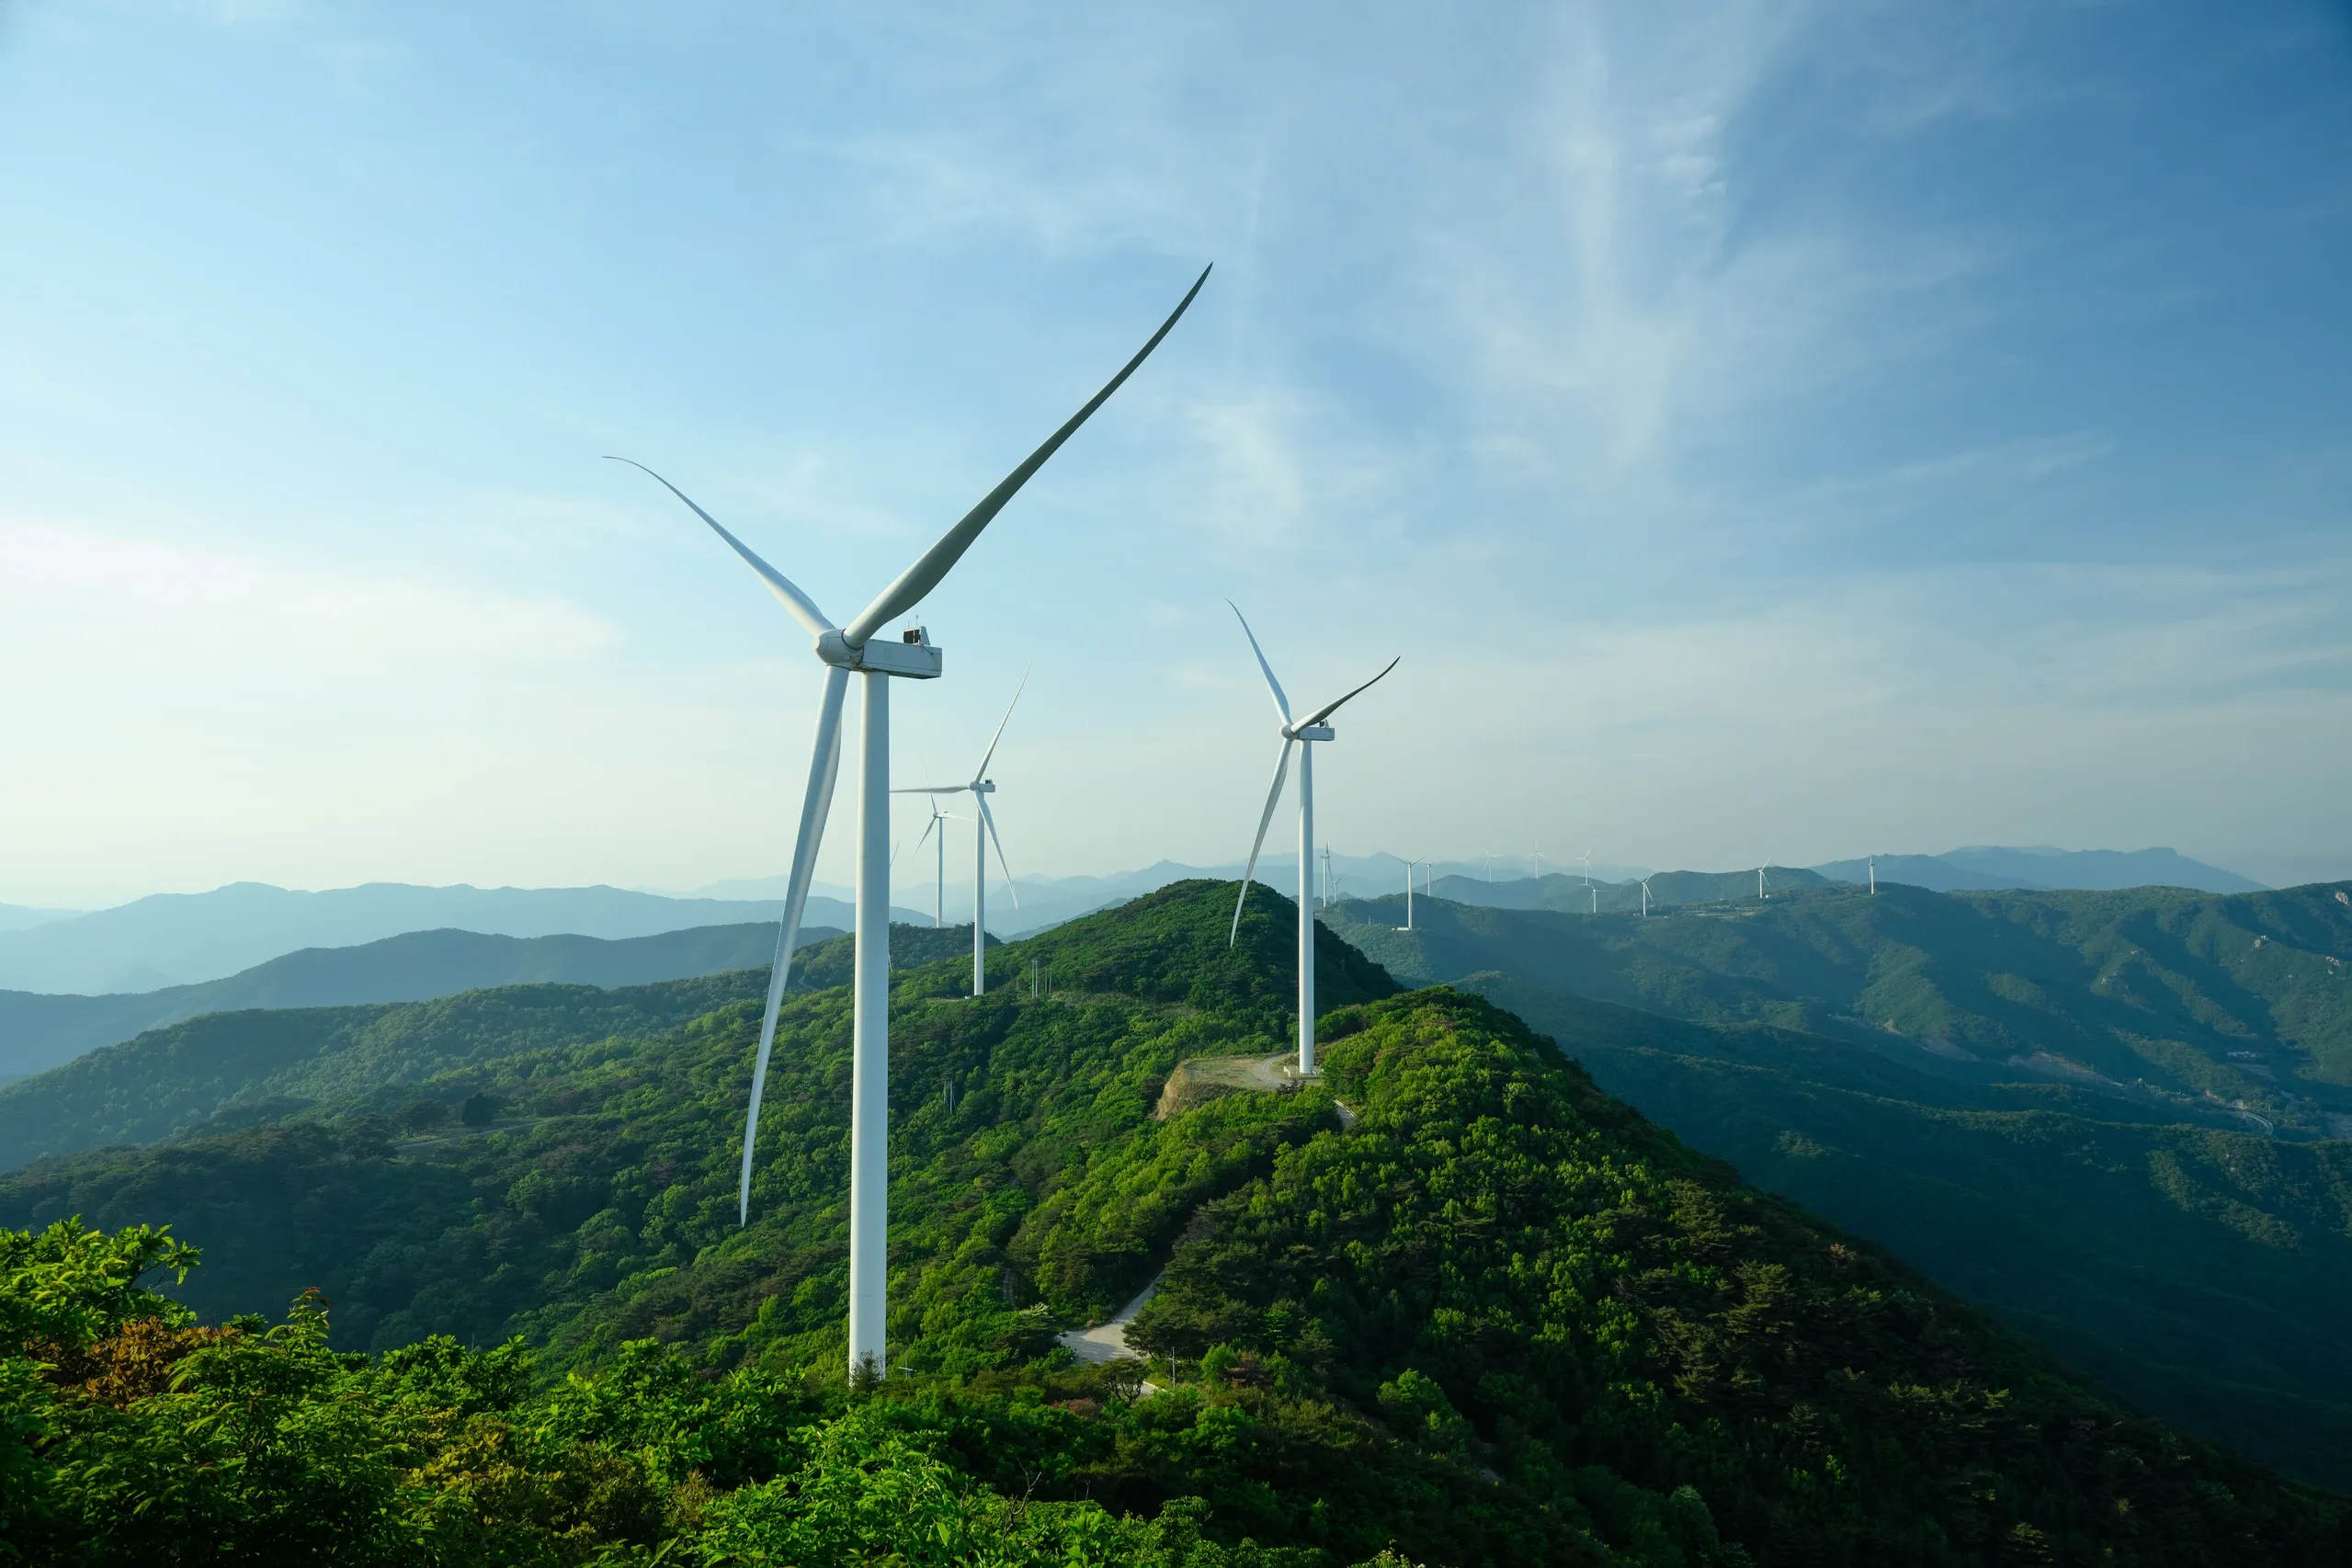
Wind turbines along a forested mountain ridge
Foundation risk · next winter
27% Range 19–36%
Top 1% of 2,300 foundations

Recommendation Inspect the foundation before November and re-level the plinth if confirmed.

Plinth settlement · since commissioning −4.0 mm Inspect: rank 7 of 2,300
Tracking · electricity
  • Movement
  • Heat
  • Change
  • Vegetation

Delivery

Which towers to dig up, and which spans get the cutting crew before winter.

Tower foundations settle and tilt where the ground moves; spans fault where vegetation grows in. We measure movement at tower bases across the network and track growth along the corridors, so excavation and cutting crews go where they are needed first.

Storage

Plinth and compound settlement during and after construction, plus site heat exposure.

Battery and substation compounds sit on engineered platforms that keep settling after construction. We measure plinth and compound settlement from baseline through operation, and the heat exposure of each site.

  • 01

    Tower foundations ranked by measured movement

  • 02

    Vegetation growth tracked span by span

  • 03

    Compound settlement from baseline through operation

  • 04

    Heat exposure across storage sites

05 / Construction

Construction

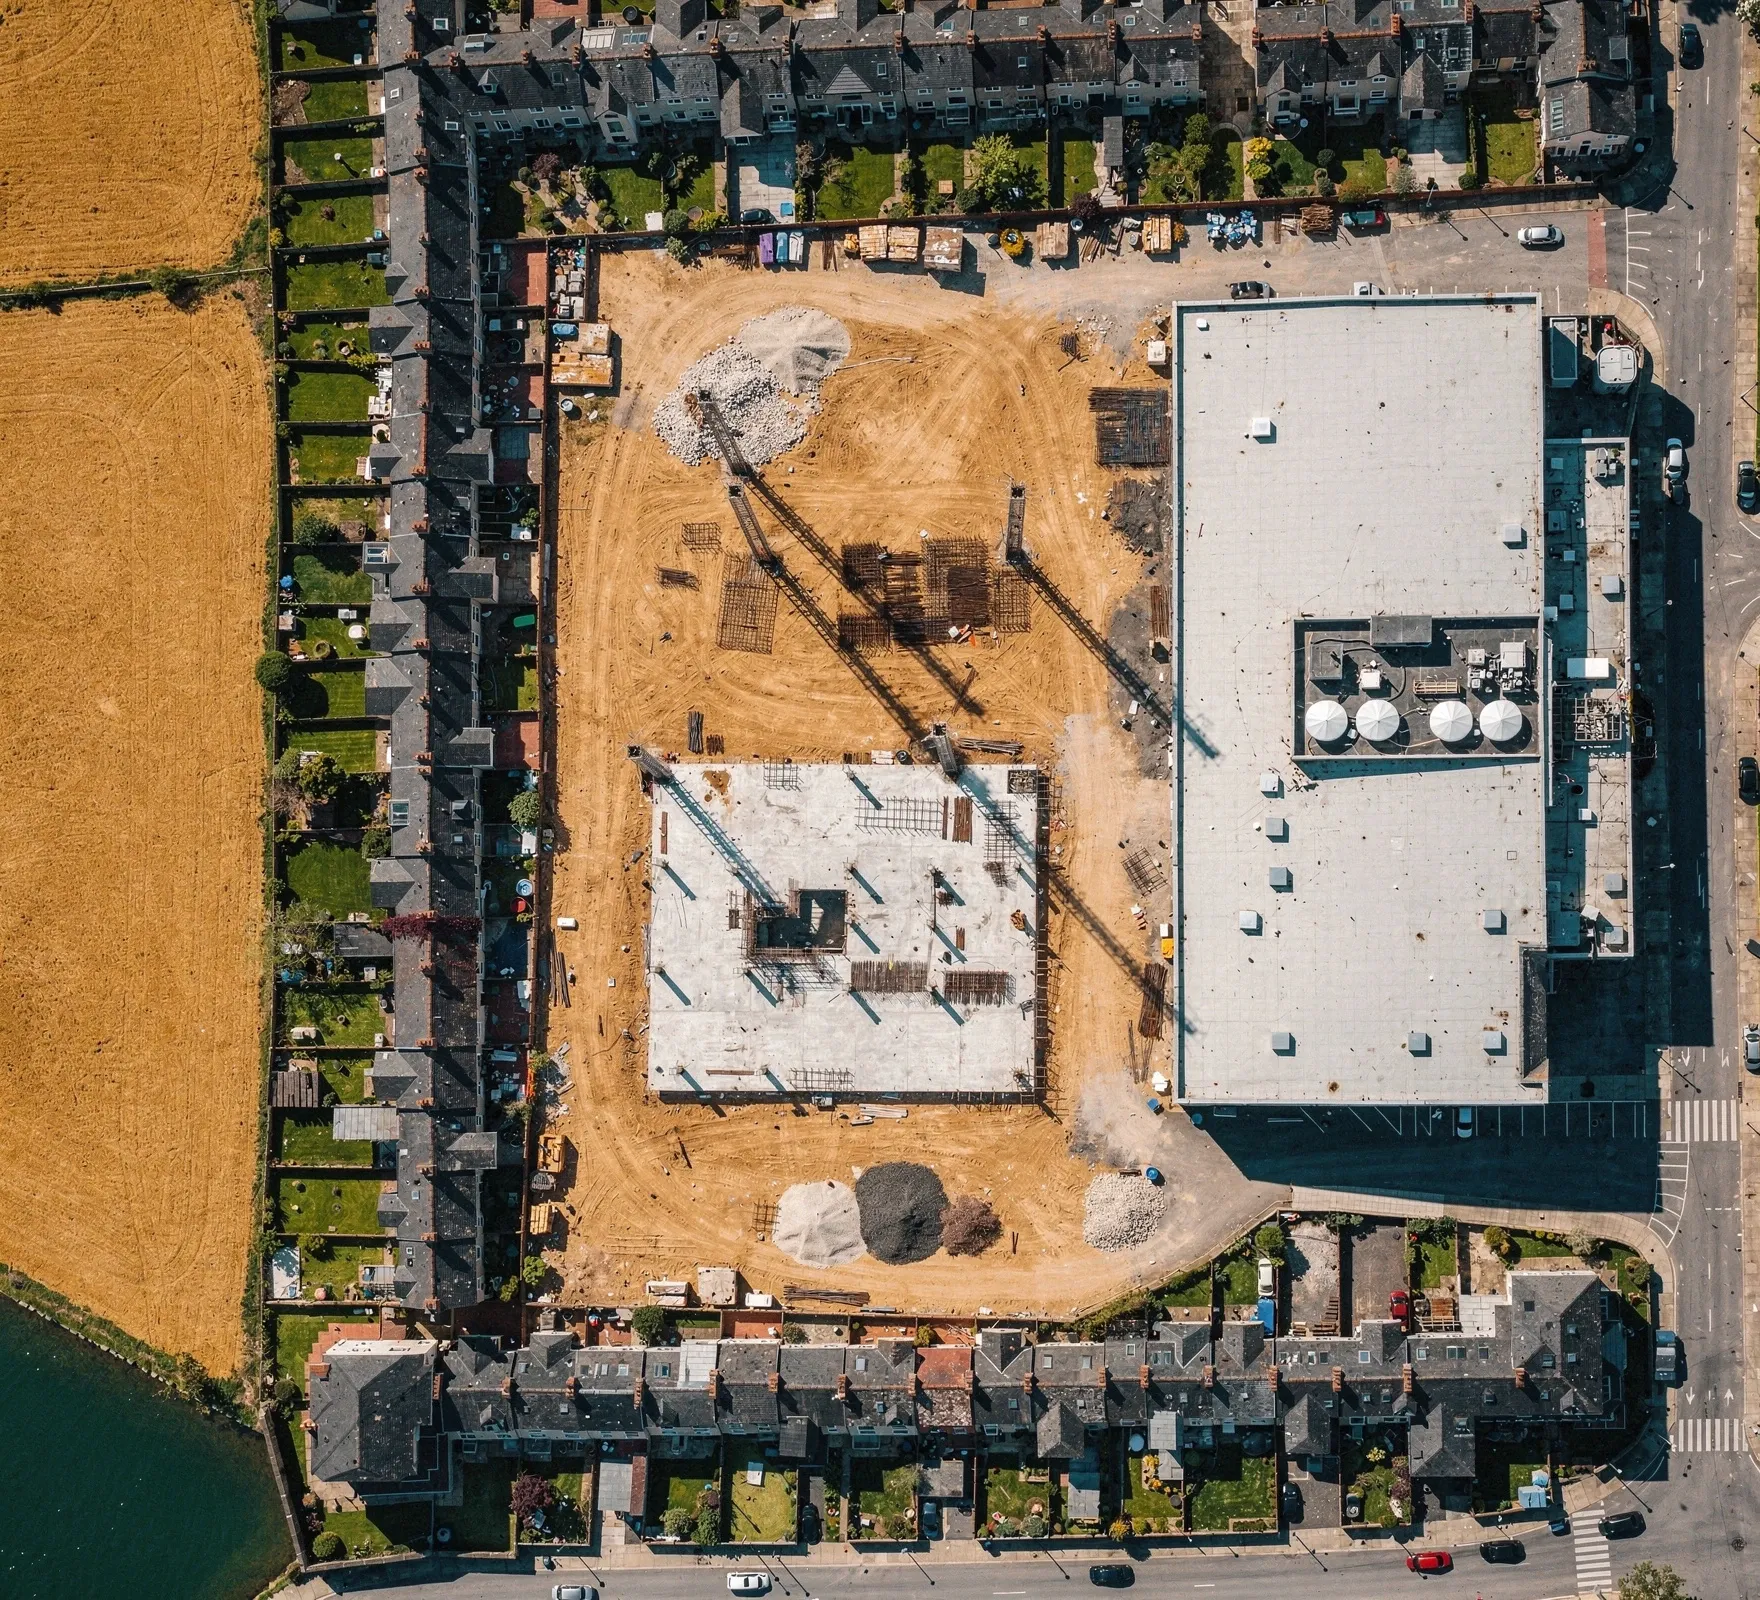
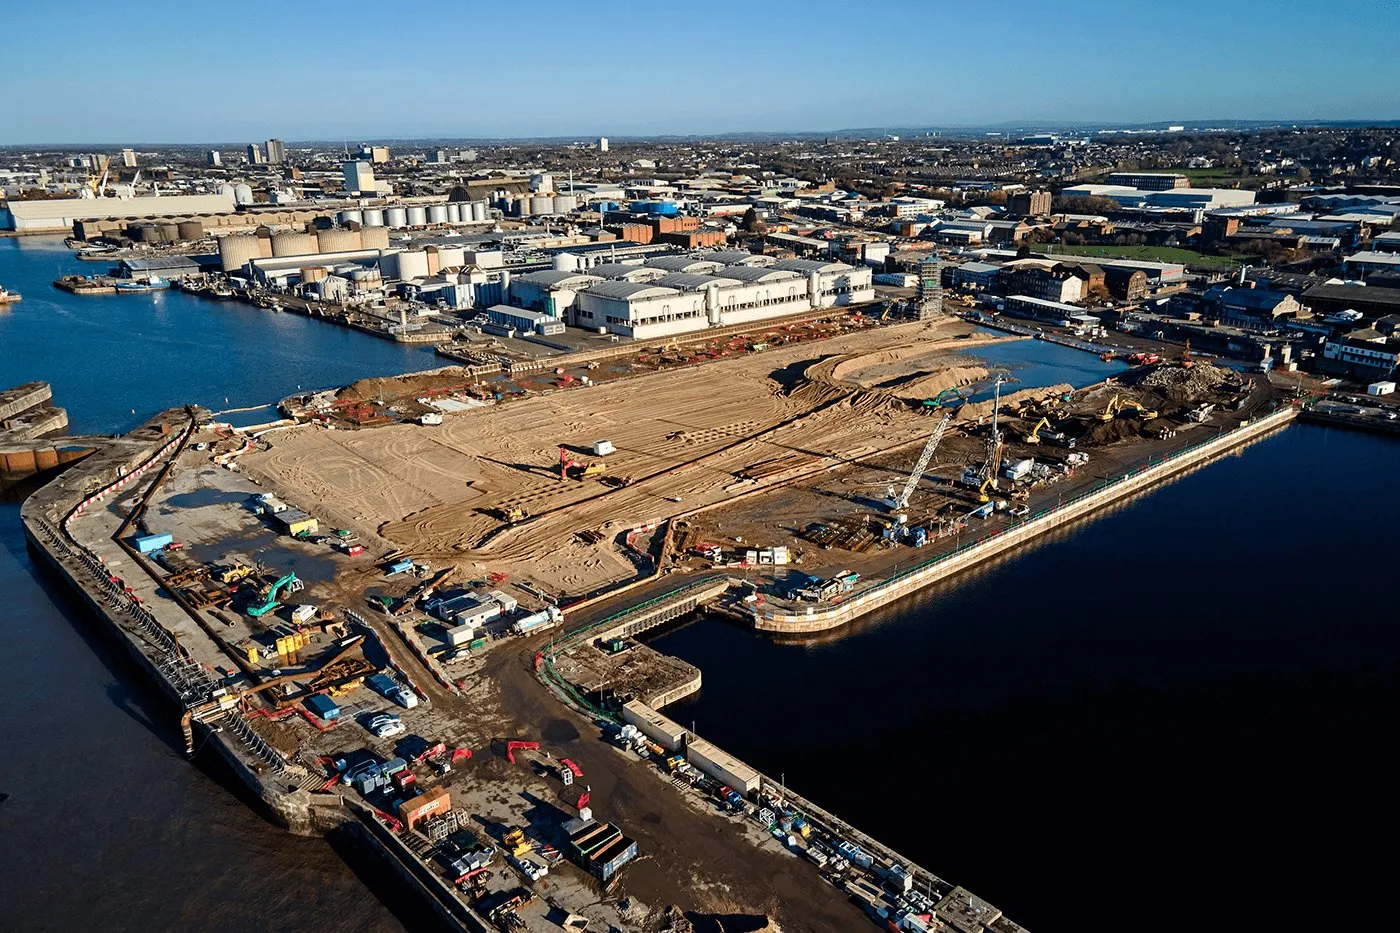
Know how the ground and the buildings next door behaved before you broke ground, watch them as you build, and hold the evidence when questions come.

City-edge construction site next to terraced housing
Trigger breach · during excavation
9% Range 5–14%
Priority 2 of 18 neighbouring buildings

Recommendation Continue works. Move monitoring to weekly while the basement is dug.

Adjacent façade · since baseline −0.8 mm Within trigger level
Tracking · construction
  • Movement
  • Heat
  • Change
  • Vegetation

The decision

Protect what you build, and what you build next to. We establish a baseline of ground and structural movement using available in-situ and satellite data before work starts, then monitor through construction and handover with site sensors and survey data in the same place. When a crack appears next door, the record shows whose movement it is.

  • 01

    Baseline ground behaviour before breaking ground

  • 02

    Proactive alerts as you build

  • 03

    Protect adjacent and heritage structures

  • 04

    Defensible compliance evidence

Evidence

06 / Aviation

Aviation

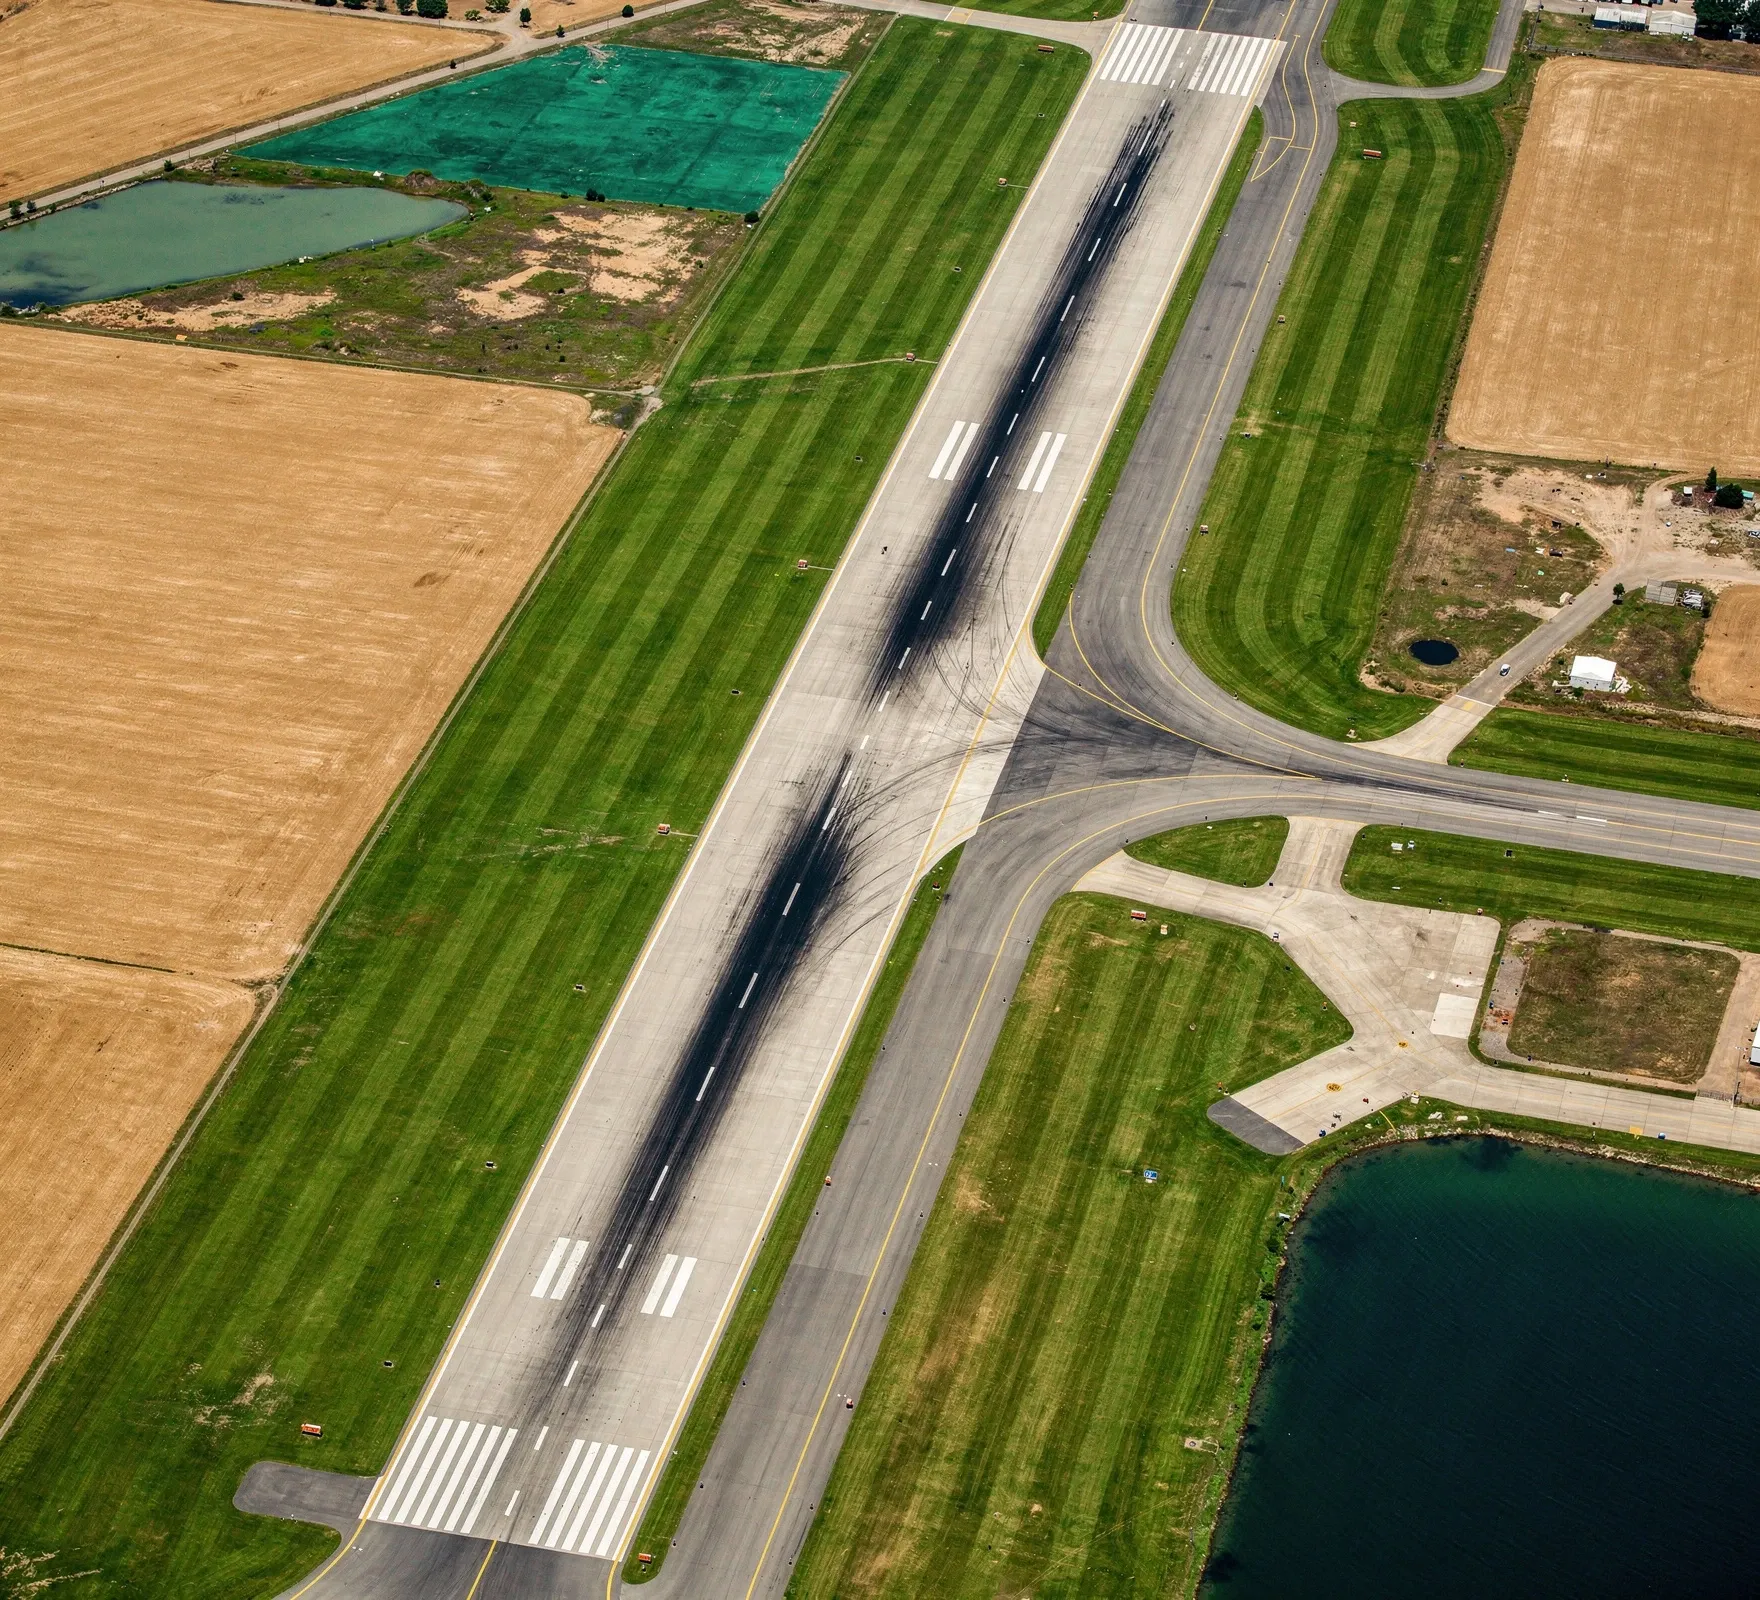
Runway condition across a whole network of airfields, from paved runways to remote strips, updated as data feeds are refreshed.

Runway and taxiways with grass infields
Closure risk · next 12 months
7% Range 4–11%
Priority 5 of 32 airfields

Recommendation Plan a mill-and-overlay for 2027; full reconstruction is not needed.

Runway surface · last pass Usable Change since last usable state: low
Tracking · aviation
  • Movement
  • Change
  • Surface quality
  • Vegetation

The decision

On paved runways, the question is when surface wear calls for mill-and-overlay and when damage has reached the base and needs reconstruction. On remote strips, it is simpler: is it safe to land today? High-resolution imagery shows cracking, potholes, standing water, erosion, vegetation along the edges and obstructions on the strip. Rainfall and soil moisture show when a strip that looks intact may no longer carry an aircraft's weight. Each pass is compared with the last known usable state, and significant change is flagged, including after heavy rain, flooding or storms.

  • 01

    Surface condition graded runway by runway

  • 02

    Usable, high-risk or not-usable status for remote strips

  • 03

    Alerts after heavy rain, flooding and storms

  • 04

    A network-wide view without sending an inspection team

07 / Insurance

Insurance

Price and manage subsidence and infrastructure risk on measured evidence, property by property and across the whole portfolio.

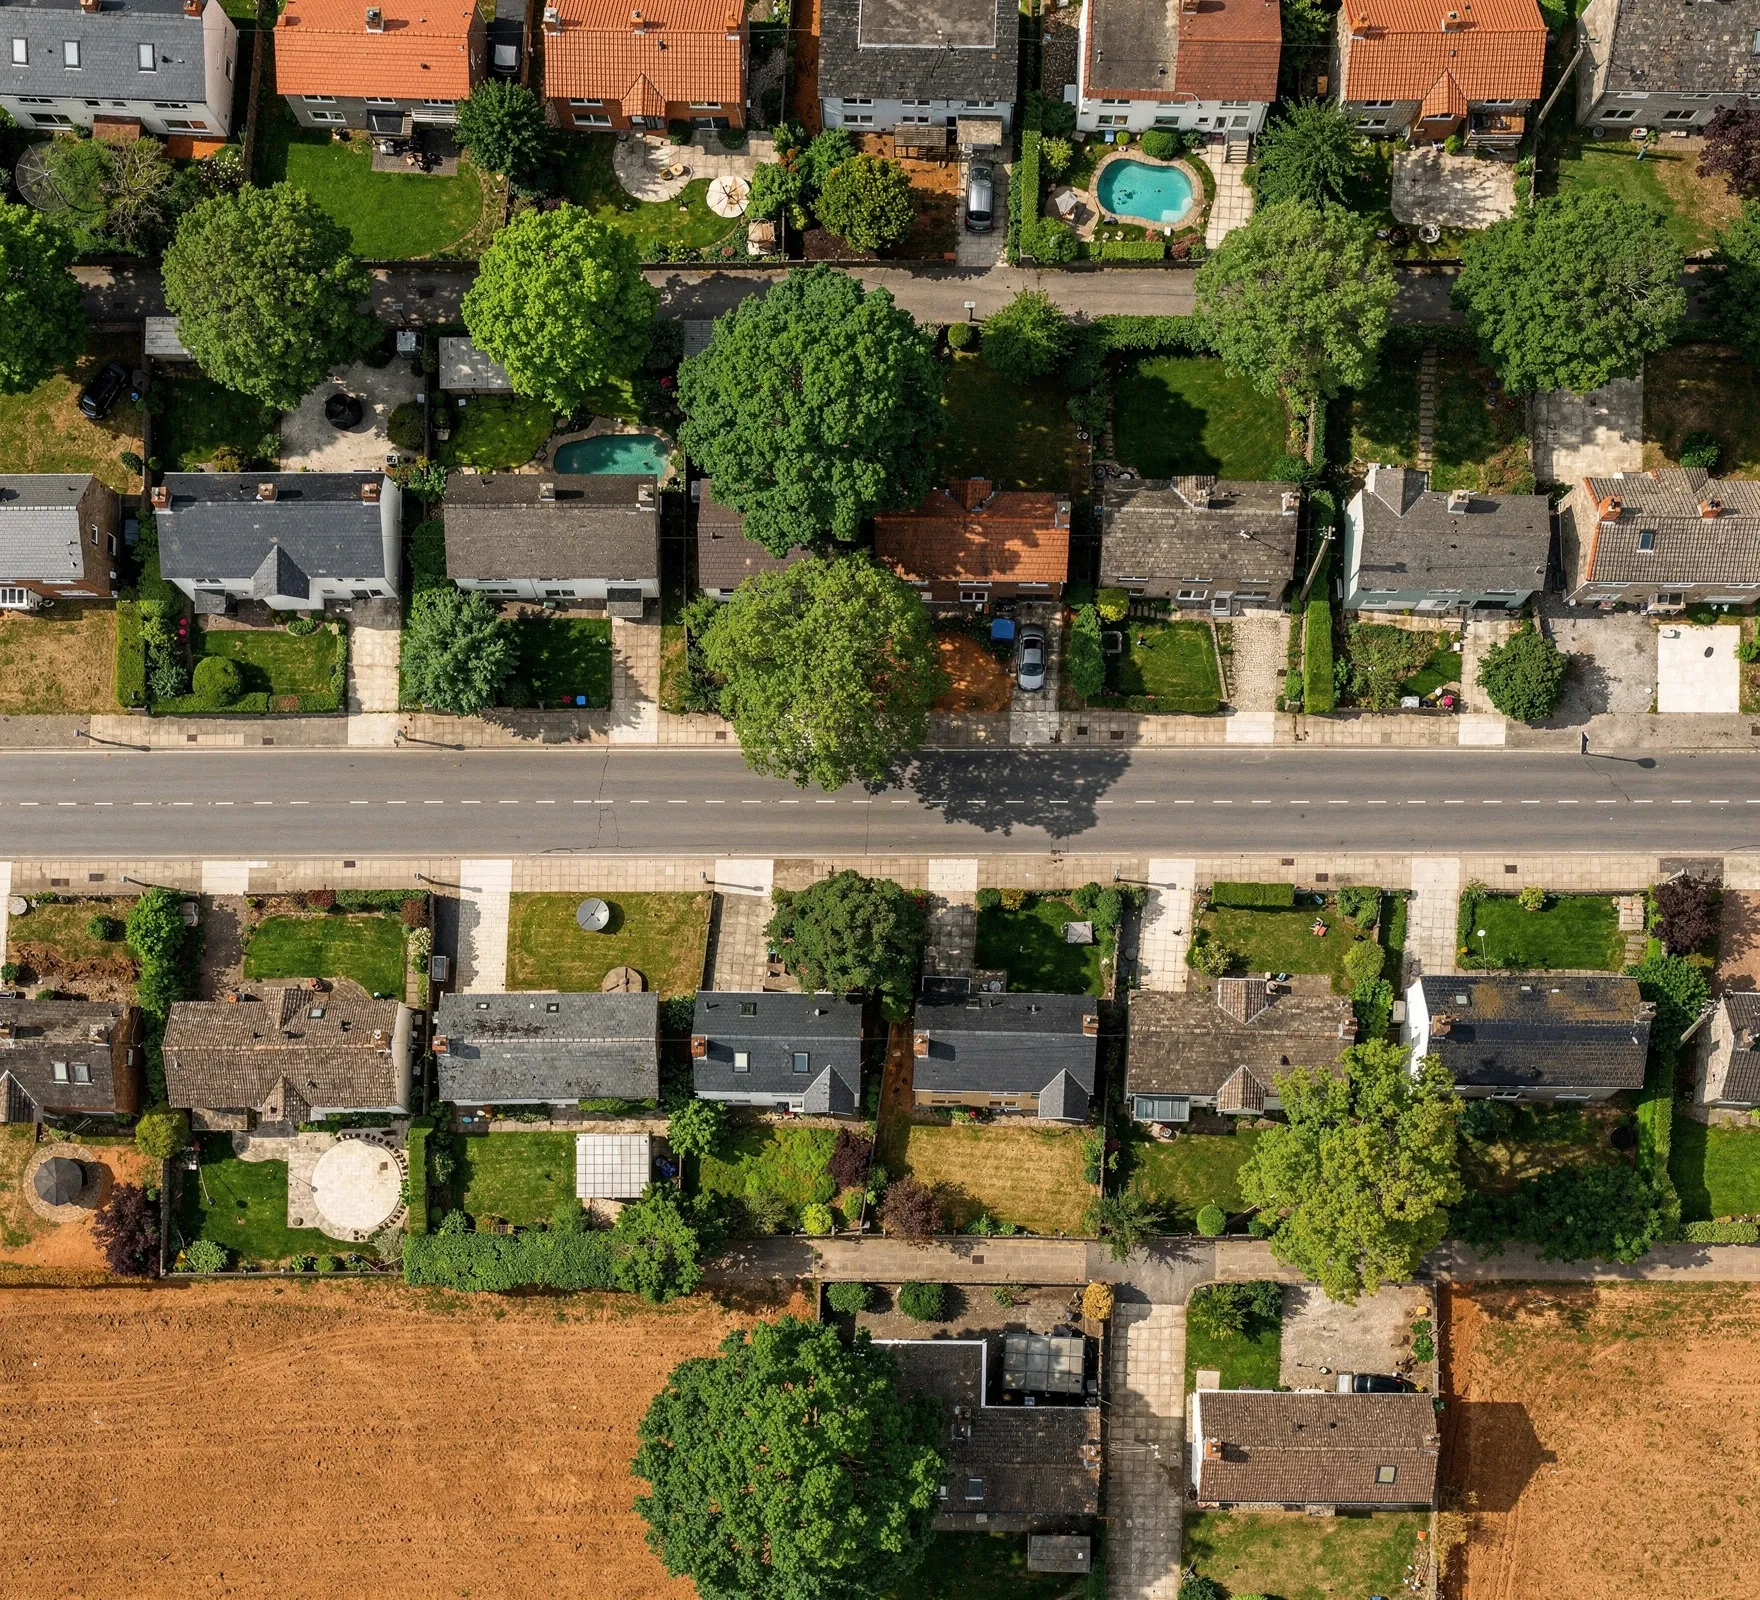
Suburban streets on clay with mature trees
Subsidence claim risk · next dry year
14% Range 9–20%
Top 5% of the portfolio

Recommendation Review cover terms and offer tree-management advice to the policyholder.

Property · observed movement range ±5.6 mm Clay exposure: high
Tracking · insurance
  • Movement
  • Change
  • Vegetation

The decision

Subsidence claims cluster in dry years, on shrinkable clay, near trees. We create standardised risk value outputs for granular components of large geographies and provide the metrics you need to connect directly to your risk assessment models.

For infrastructure portfolios we provide continuous, independent monitoring of insured assets.

  • 01

    Portfolio-wide risk visibility

  • 02

    Independent, auditable evidence trail

  • 03

    Early warning on emerging exposure

  • 04

    Quantify risk reduction over time

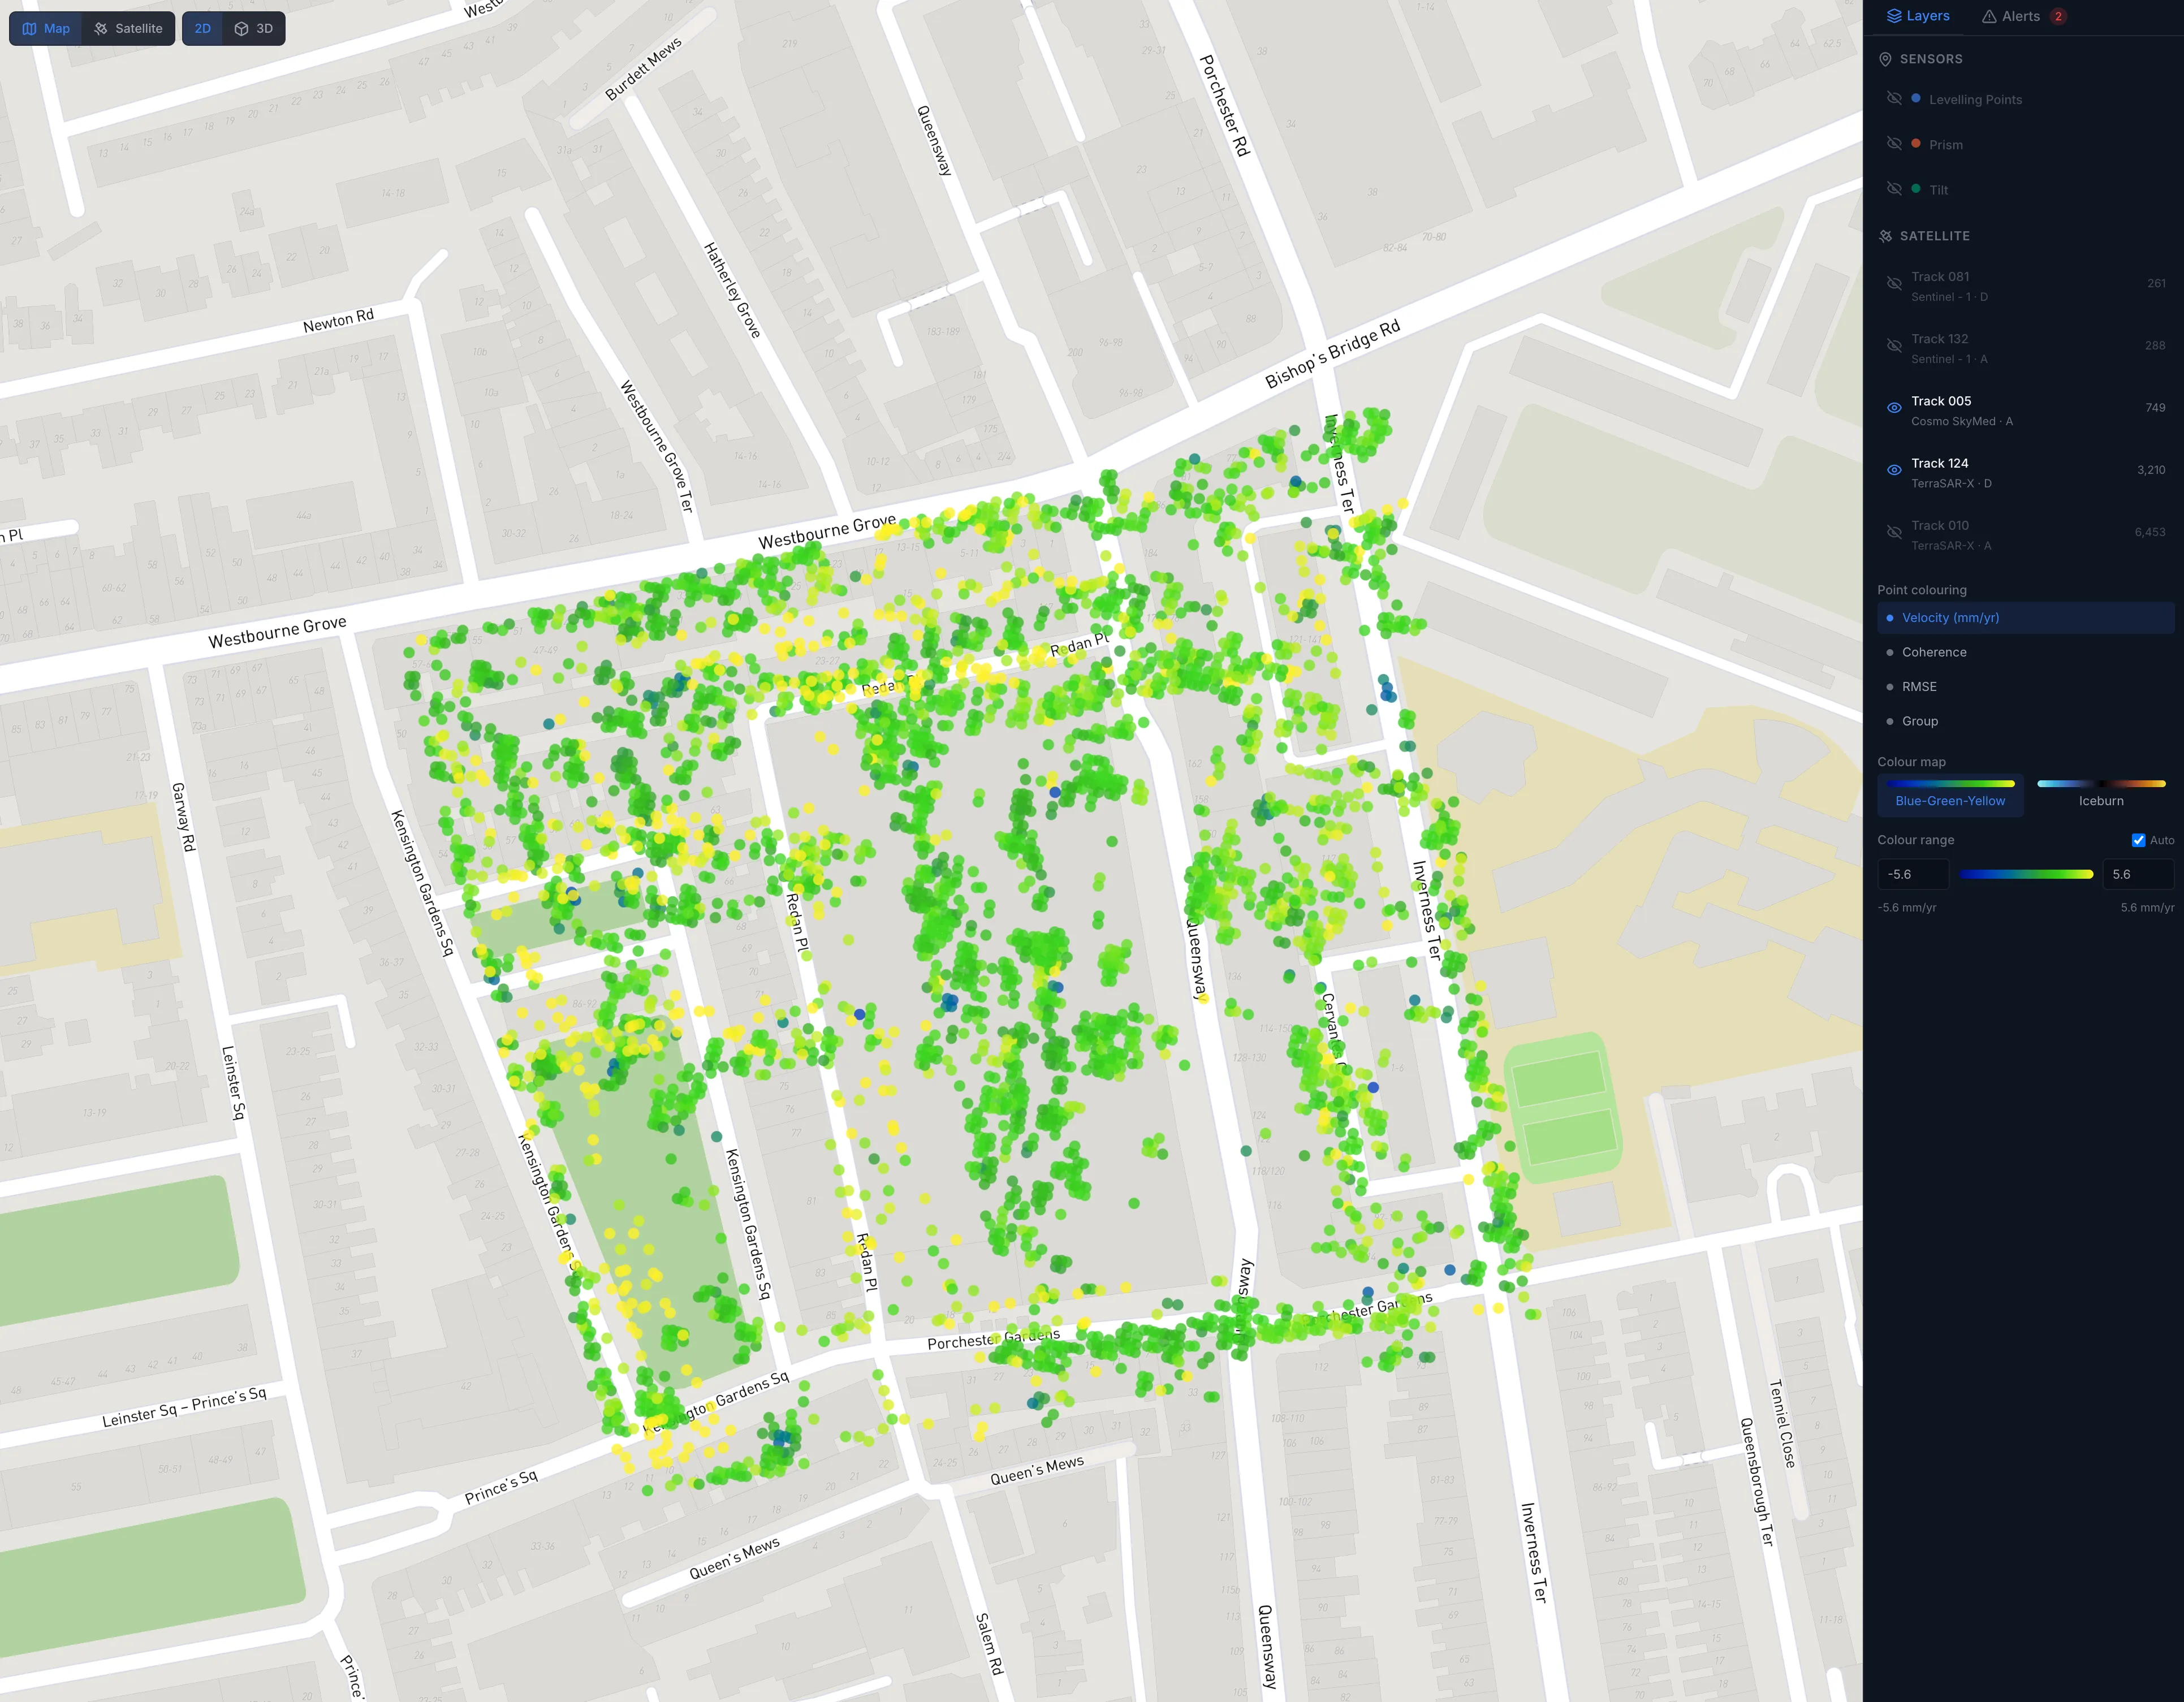
The BKWAI platform: measured ground movement mapped point by point
Answers, not data

The number you need, and what it means.

  1. 01

    Measure

    In-situ and satellite data, with historical context across the network.

  2. 02

    Interpret

    Separate anomalies and areas of concern from normal behaviour, with stated confidence.

  3. 03

    Act

    A ranked list of where to look, spend or intervene next.

Rigour
Honest about what we can measure, and clear about what we can't.

We started in research and still work that way. Every number comes with its uncertainty and its limits, so you can defend the decision it informs.

We complement inspection, instruments and surveys. We tell you where to point them.

What do you need
to see coming?

Talk to us