Mitigating the risks that climate change poses for existing infrastructure
Written by Marisa Figueiredo, Head of Data Science at BKwai
As the last few months of weather have adequately demonstrated our weather is changing and is becoming ever more extreme. It’s likely that our mild winters and moderate summers will become the exception rather than the rule.
What does that mean for a bridge that might have an expected life of 120 years? Well, in all likelihood it was designed with the expectation that the climate would remain roughly comparable year on year, and while new structures can be designed and built with the knowledge that the climate is changing, the question that sounds alarm bells is, what will happen to existing structures and how do we protect them from damage and failure?
So, what are the risk factors?
In the UK specifically, although also true in some form for every country and continent, we are expected to see hotter, drier summers, and wetter, warmer winters, in fact, according to the 2020 Global Climate Report from NOAA National Centers for Environmental Information “every month of 2020 except December was in the top four warmest on record for that month”.
Not only is the trend line changing, the frequency of extreme weather events is also increasing. Higher temperature spikes and more unpredictable and intense rainfall being of particular significance.
And what does that mean for infrastructure assets?
The impact of these sorts of climate change phenomenon are too numerous to mention them all but examples could be:
- Rainfall: More intense and frequent rainfall can change river flow conditions, increasing the risk of scour damage to bridge piers – scour damage is one of the primary causes of bridge failure worldwide.
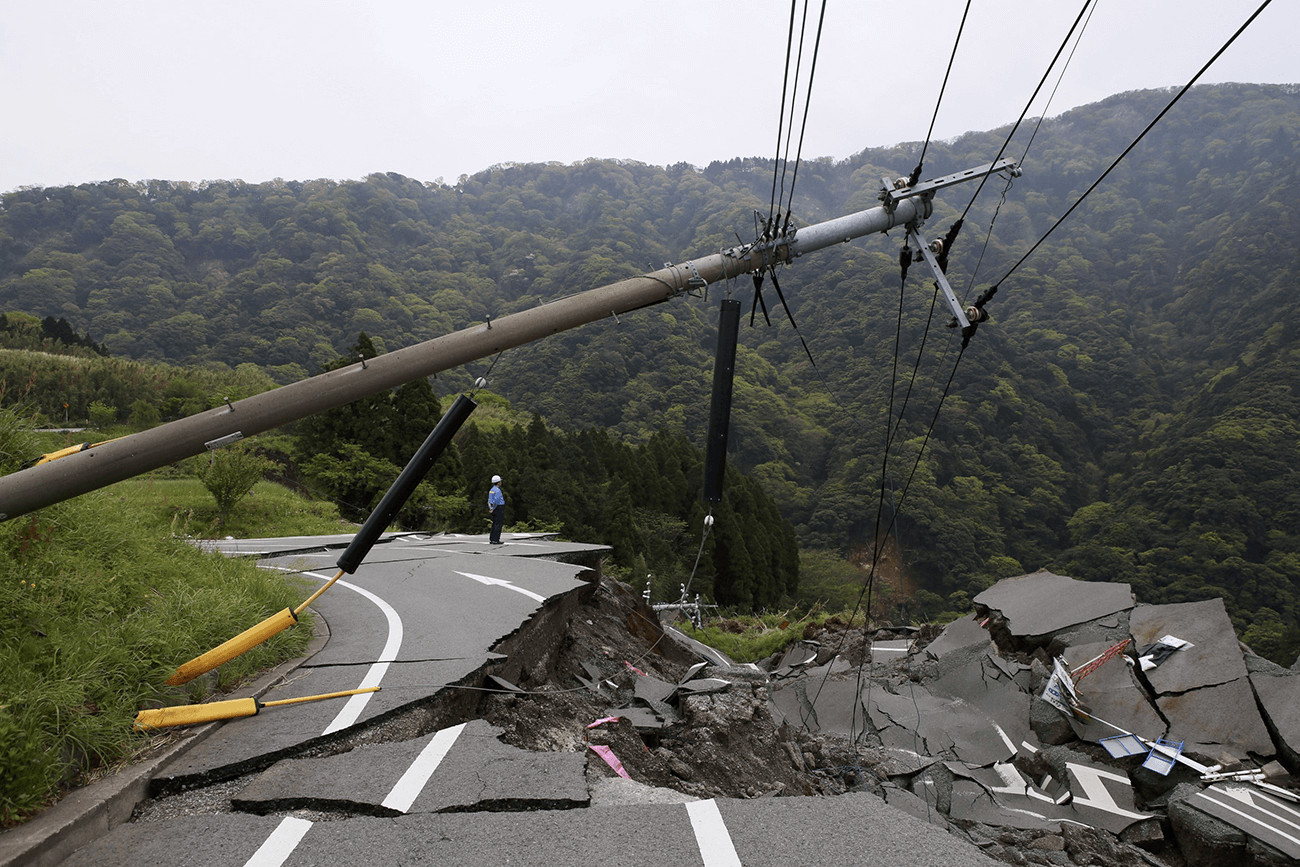
- Slippage: 2017 UK Climate Change Risk Assessment identified “Risks to transport networks from slope and embankment failure” (due to heavier and prolonged rainfall) as needing urgent action, specifically “to locate and remediate embankments and cuttings at risk of failure”. “Approximately 8% of the UK’s transport and road network is at medium to high risk of landslide disruption.” (Dawson, R.J., Thompson, D., Johns, D., Gosling, S., Chapman, L., Darch, G., Watson, G., Powrie, W., Bell, S., Paulson, K., Hughes, P., and Wood, R. (2016) UK Climate Change Risk Assessment Evidence Report: Chapter 4, Infrastructure.)
- High winds and high temperatures: Can affect bridge stability, especially in historic structures.
- Temperature spikes: Can result in operational downtime of rail networks due to tracks overheating, even creating a risk of rail buckling.
Consequences for asset owners
For asset owners and operators, the impact of climate on structures going un-noticed can vary hugely. In simple terms the earlier you know you have an issue, the easier and cheaper it is to alleviate it.
Once issues have had time to develop, assets often need to be closed or restricted for further inspections or in extreme circumstances, they can suffer partial or complete structural failure.
The implications of these can be wide ranging.
- Asset downtime and service disruption
- Increased repair costs
- Public and employee safety
- Increased insurance premiums
- Litigation
- Reputational damage
Letting technology draw insights from the data
There are many ways to help alleviate these issues, from increasing the frequency and depth of manual inspections to closer monitoring of sensor data. However, these are expensive and time consuming.
Platforms such as that from BKwai, allow the layering of multi-sourced data to provide a richer dataset from which the sophisticated algorithms can easily identify insights that would have taken hours, if not days with manual analysis of the data. Our software delivers those insights straight into the engineers’ hands to enable them to make smarter decisions about the structure and its maintenance.
Imaging the situation; You operate an asset that has been in existence for 50 years. Six months ago, sensors were installed to check the movement of the bridge, those sensors have identified movement. The only thing you now know is that there is movement, you do not have sufficient data to make an educated decision.
Now imagine you can lay over 5 years’ worth of InSAR satellite data which identifies deflection around and on that asset. Now you have a layer of rich data that offers insights not available to you by any other means. Added to that, by layering additional dimensions such as weather, tidal movements, traffic patterns or even construction site activities, insight into root cause becomes a reality.
If the satellite data shows no movement until the last 6 months, then this is unusual and needs investigation. However, if it shows the same movement, in a repeating pattern over the past 5 years you can realistically assume it’s ‘Normal’ behaviour. Looking forward you have a baseline to work with and, as the weather changes, you can see what is unusual while building a pattern to see if there is a trend of surface slippage or bridge deflection which you can plan and prepare for either in your physical inspections or pre-emptive mitigation work.
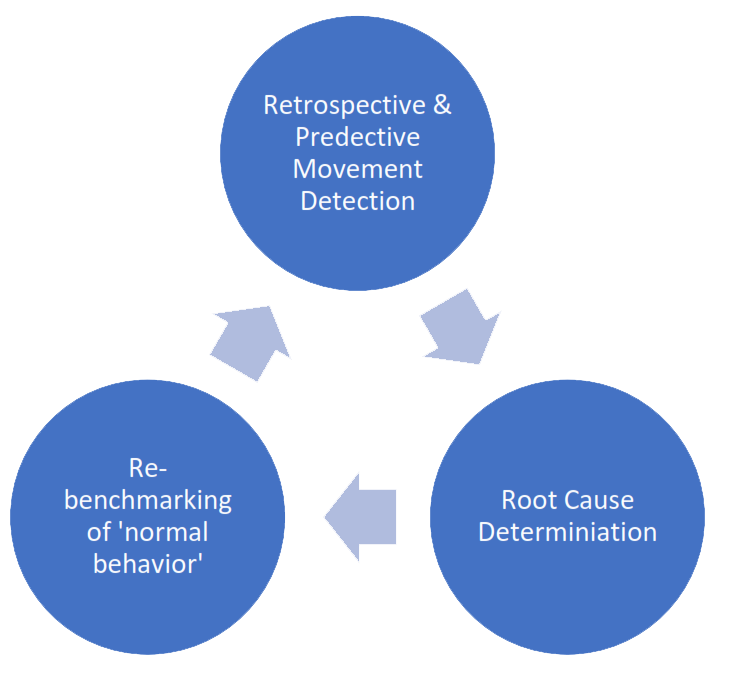
In summary, modern I&M hardware combined with cutting edge data analytics gives us more real-time access to asset movement, helps with calibrating what is ‘normal and expected behaviour’ and helps with determining root cause.
To find out how BKwai can enable you to make smarter construction and asset monitoring decisions please contact us