Why Understanding Cause is More Important than Effect
Written by Andrew Covey, Head of Marketing at BKwai
According to the June 2022 Geotechnical Instrumentation and Monitoring Market report, the 2022 global spend on geotech instrumentation and monitoring will top US$3B. In the UK alone, this equates to an expected spend close to US$100MM. Not only is this a huge financial investment, it is also reflective of just how much site monitoring data is being generated. So what exactly are we going to do with all this data and why is it so valuable to both contractors and asset owners?
The science of construction site monitoring is far from a new discipline – it has been around for centuries. However, the means by which we are able to capture site information, and the real-time nature in which it is captured and transmitted has dramatically changed. Automation has driven the cadence and quantity of data we are able to glean.
Having said that, one fundamental concept has remained constant. The primary data we are capturing today still pertains to the location of an entity – a location on a bridge; the corner of a building, the height of a railway track etc. On a construction site, we measure location through either a relative or absolute value and there are many standards in place such as the UK’s Ordnance Survey’s Benchmark system (height tracking) for tracking the movement of physical assets.
Yet with such an abundance of data comes a challenge – more data doesn’t automatically result in better insight or greater knowledge. There is a transformation that has to be made between data and knowledge. Data is a set of numbers; conversely, knowledge brings an understanding of what those numbers are telling us. While the I&M industry is, without question, experiencing a huge adoption boom, it is still in it’s infancy with regards to truly leveraging data to help better drive smarter decision-support. That is where site monitoring analytics come into play.
Site Monitoring Analytics
Site monitoring analytics can be separated into two parts:
- Movement detection (the effect)
- Root cause
Movement Detection
Firstly, by comparing positional data over time, we can determine not only movement but also the rate of change of such movement e.g. this asset is moving at a rate of 10mm per week. Again though, in order to be truly useful this insight needs to be presented with context – context as to what is firstly normal behaviour and secondly, is this normal behaviour within our thresholds or design tolerances?
In order to establish what is normal behaviour, we need a benchmark and the best way of establishing such a benchmark is to look back through time and try and determine a historical trend.
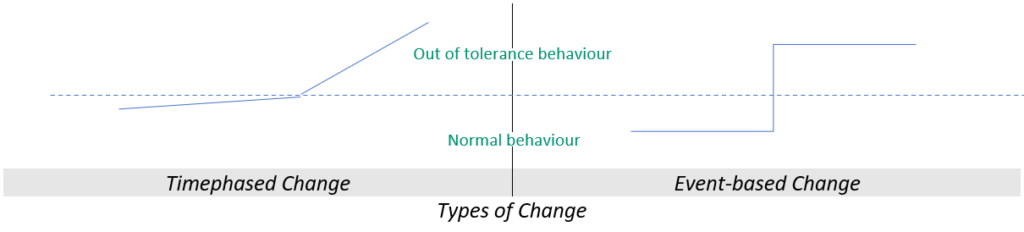
By establishing such a benchmark, we can then compare recent movement against the trend so as to determine whether the change is out of ‘tolerance from the norm’ and if so, was it caused by change over time or a discrete point-in-time event such as a vehicle collision.
With the advent of cloud computing and data mining, capturing and analyzing very large quantities of data to help establish benchmarks is becoming an affordable reality. With the availability of such benchmarks, we can now make much better judgment calls as to whether a positional change should be of concern or not.
In the case where it is deemed to be a material concern, the real question to be answered is ‘what is the root cause of this change?’. If this can be answered, then we can develop a response to the driver of the change, hence de-risking the probability of a failure or damage. The value here is all about de-risking…
Determining the Root Cause of Movement
Engineers working on the construction of a super sewer in an area prone to flooding are using the BKwai platform to help forecast flooding.
A change in position of an asset can be caused by or influenced by numerous factors (and worse, potentially compounded by a combination of factors). Daily cycles in temperature, traffic patterns, scheduled site work, an unforeseen incident are all examples of movement cause.
The more context we can apply to a given entity, the better chance we have of pinpointing the root cause of it’s movement. This is where the concept of multi-dimensional analysis comes into play.
If we take a given sensor and overlay additional dimensions such as temperature, then we can start to determine whether the movement change is correlated with a corresponding change in the weather. Relatively easy to do in the age of easy access to weather-related data.
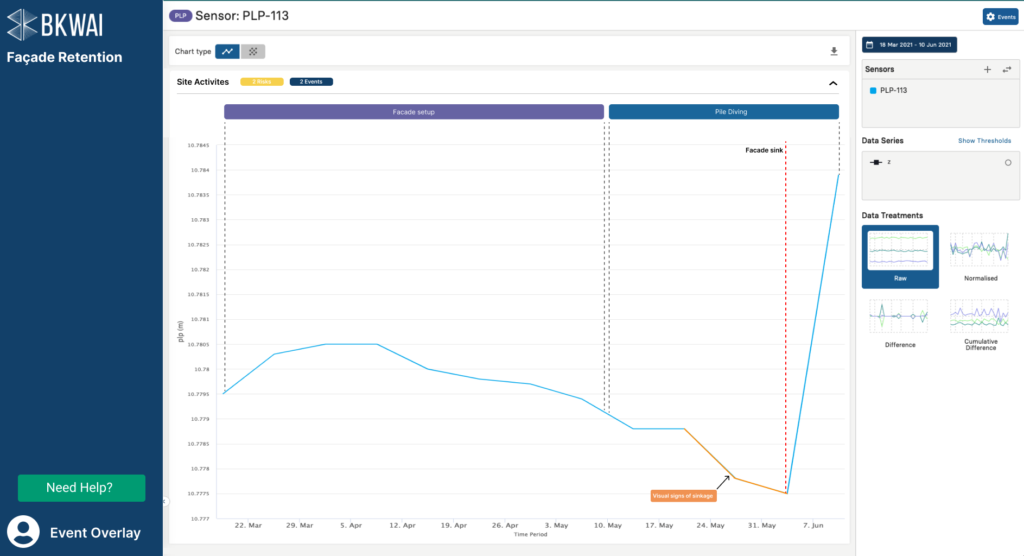
Taking this a step further, overlaying disparate data sources and tying them back to the timephased data stream we get from a sensor and we broaden our ability to truly determine root cause. A real-world example of this can be seen the BKwai view below that shows site activities being pulled from the construction schedule and overlaid onto the site movement chart. From this we can see that there is a direct link between pile driving activities and the asset experiencing a material and threshold-breaching change in position.
Pinpointing the root cause back to the pile driving activities enables us to not only record the event in the form of an auditable digital thread but also gives us the opportunity to remediate a subsequent analogous event in the future.
The concept of multi-dimensional root cause analysis is a major step forward in asset monitoring. For the first time, stakeholders can now get not only a single source of truth pertaining to an asset, but more importantly, get guidance on the cause of change to that asset. Weather and site activities were mentioned as examples above. Imagine the possibilities over time as we continue to digitize construction environments.
To find out how BKwai can enable you to make smarter construction and asset monitoring decisions please contact us