Looking at one aspect of a building or asset tells you only one thing, aligning and correlating multimodal data allows you to see much more.
Written by Andy Covey, Head of Marketing at BKwai
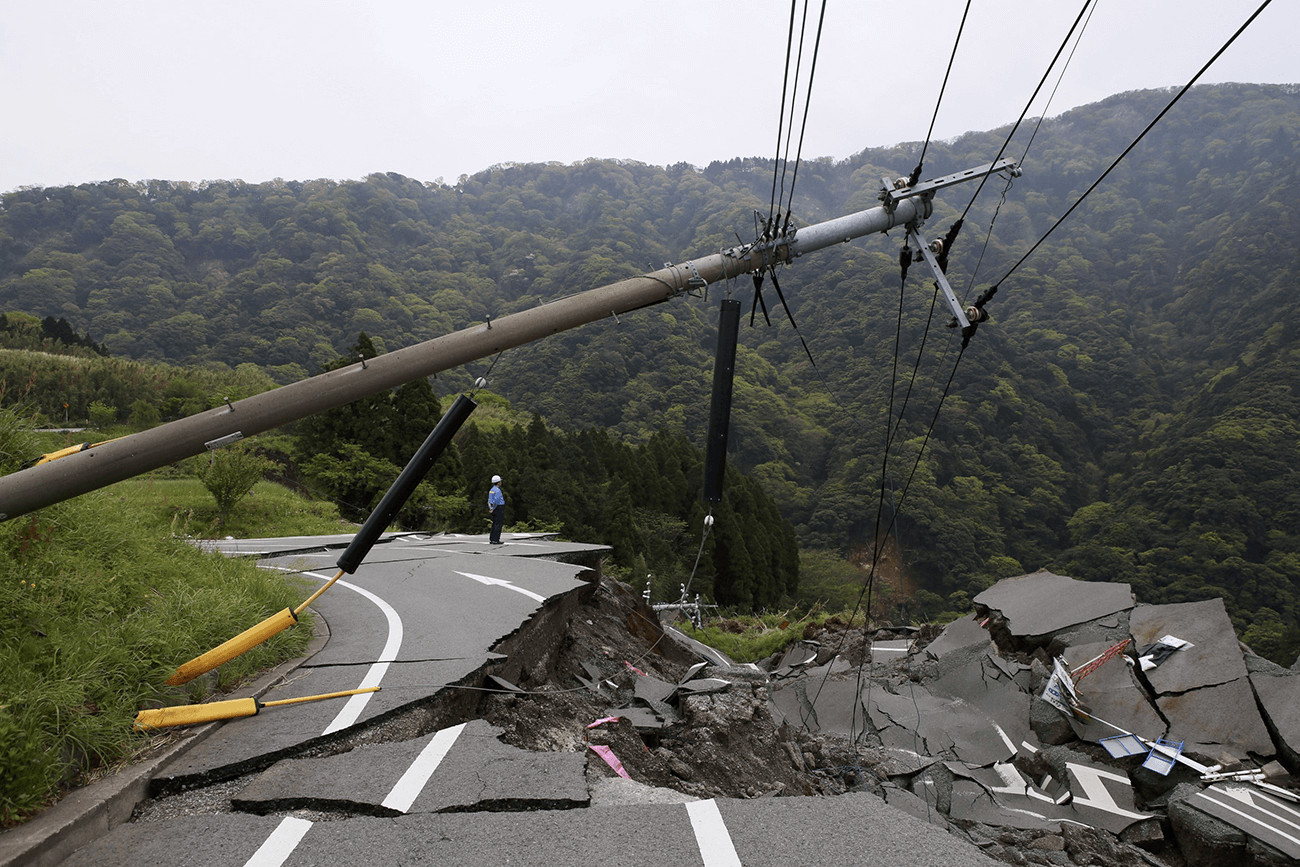
Imagine you own a bridge, and your physical sensors tell you that there is movement. What do you do? You could close the bridge to investigate the movement, you could restrict the access while you carry out more monitoring or you could step back and look at a wider picture of the situation with the use of historical InSAR satellite data.
Why does historical data make such a difference?
Different sensors tell you different things. Installing sensors on site can give high frequency readings every few hours, minutes, or seconds in very localised regions to tell you what is happening now. What they don’t provide is context.
If you were blindfolded and presented with each of the items below, what might you think it was?
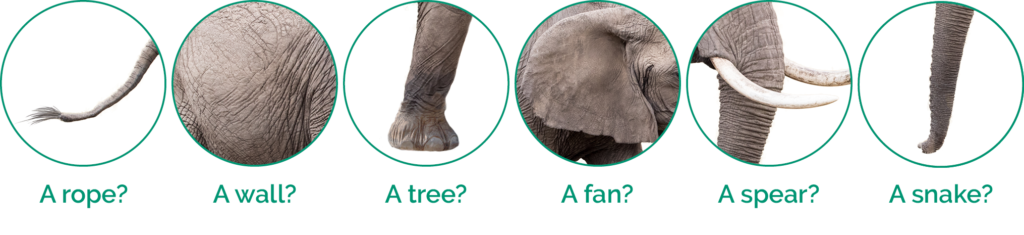
Now you stand back and remove your blindfold, the truth is revealed.

By looking at historical data we can see if the movement follows a pattern, perhaps seasonal in response to high or low temperature, or as part of rising water levels.
When that information is coupled to the current sensor readings it is far more likely to reveal the true picture or at least insights into that picture.
The ideal solution is to use different tools for different jobs. Products like the BKwai platform can, for example, apply sophisticated machine learning to remove the fluctuations created by temperature leaving you only the truth…is the structure actually moving or is it merely responding to its environment as it does every year?
Is historical data the only time I can reveal the elephant?
No, one of the key benefits of the BKwai platform is that it can bring in information from any brand or type of sensor as well as many other sources such as weather, to provide a single source of truth. As the effects of climate change become more evident the integration of temperature and flood maps into the platform will offer invaluable insights into the truth of your asset, it’s site and the surrounding area.
Rather than logging into a platform for each type of sensor or the environmental data and viewing it in isolation you see everything in relation to each other. Instead of looking at each of the elephants’ legs individually, we reveal the entire animal in a single view.
To find out how BKwai can help you see the full picture please contact us